Disconnection Rates and Data Collection Across U.S. States
Analyzing disconnection rates and data collection efforts for utility shutoffs across various states in the U.S. highlights the need for standardized documentation and reporting. The data provides insights into the average disconnection rates, vulnerable group impacts, and the number of customers in arrears, emphasizing the importance of addressing utility shutoffs as a public health issue and a driver of displacement.
Download Presentation

Please find below an Image/Link to download the presentation.
The content on the website is provided AS IS for your information and personal use only. It may not be sold, licensed, or shared on other websites without obtaining consent from the author.If you encounter any issues during the download, it is possible that the publisher has removed the file from their server.
You are allowed to download the files provided on this website for personal or commercial use, subject to the condition that they are used lawfully. All files are the property of their respective owners.
The content on the website is provided AS IS for your information and personal use only. It may not be sold, licensed, or shared on other websites without obtaining consent from the author.
E N D
Presentation Transcript
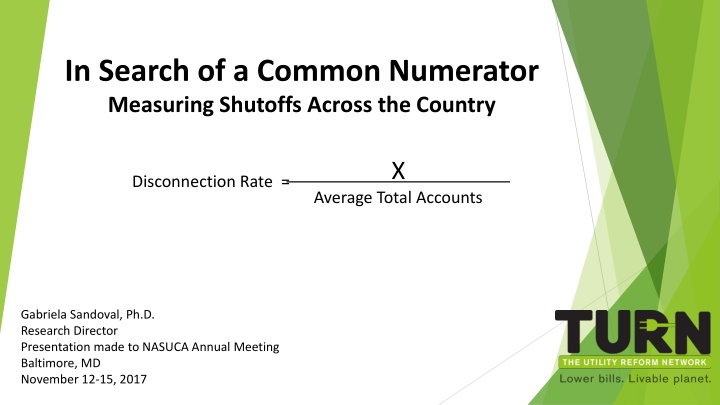
In Search of a Common Numerator Measuring Shutoffs Across the Country X Disconnection Rate = Average Total Accounts Gabriela Sandoval, Ph.D. Research Director Presentation made to NASUCA Annual Meeting Baltimore, MD November 12-15, 2017
Addressing the Health and Housing Impacts of Utility Shutoffs Demographic Analysis GIS mapping Participatory Research Survey Storytelling and Narrative work Mini-documentaries Policy Advocacy Ratepayer mobilization Reframing shutoffs as a public health issue and as a driver of displacement
The Upshot We need standardized documentation and reporting of disconnection data across all 50 states and Washington D.C.
How Many States Collect Data on Shutoffs? Data Analysis complete 20 Partial data identified Getting back to us soon Confirmed data not available Emailed contact; no repsonse so far TOTAL 4 4 14 9 51
Average # of Residential Accounts Disconnection Notices (duplicate households) % of Customers in Disconnection Rate for Vulnerable Group Disconnections Average Disconnection Rate Disconnection Rate Range # Customers in Arrears Arrears Vulnerable Group Reported Notes IOU NATIONAL TOTAL 75,049,677 25,323,054 3,005,631 3.7% -- 5,470,078 16.6% -- -- -- Arizona 2,868,023 n/a 230,527 8.0% 0.0% - 21.8% n/a n/a n/a n/a 2016 Maine 686,287 762,477 51,738 7.5% 3.4% - 8.5% 180,282 26.3% n/a n/a 2016; involuntary disconnections only 1,515,711 n/a 82,576 Washington 5.4% n/a n/a n/a n/a n/a Most recent data available for 2012 calendar year. California 16,651,940 8,258,071 868,898 5.2% 1.8% - 9.3% 2,121,549 21.6% Medical Baseline 1.0% 2016; disconnections for non-payment only North Carolina 4,513,167 n/a 229,519 5.1% 4.3% - 5.4% n/a na n/a n/a 2016; disconnections for non-payment only Washington DC 405,219 386,091 20,581 5.1% 4.2% - 6.0% 102,872 25.4% Low Income 19.0% 2016; disconnections for non-payment only Maryland 2,557,059 3,773,251 125,330 4.9% 0.0% - 7.7% 420,120 16.4% n/a n/a 2016 Pennsylvania 7,543,525 n/a 320,455 4.2% 1.4% - 6.3% 691,664 9.2% Low Income (<150% FPL) 14.2% Most recent data available for 2015 calendar year. Illinois 7,969,625 n/a 308,238 3.9% n/a n/a n/a n/a n/a Most recent data available December 2015 - November 2016. Massachusetts 3,741,337 1,711,069 131,038 3.5% 0.0% - 6.6% 25,365 0.7% Low Income 6.0% 2016 New York 8,377,022 5,187,366 206,883 2.5% 0.5% - 4.3% 897,926 10.7% n/a n/a 2016; disconnections for non-payment only Minnesota 2,516,803 1,247,943 59,224 2.4% 0.4% - 4.3% n/a n/a n/a n/a 2016; involuntary disconnections only 2,106,278 Colorado n/a 42,978 2.0% 1.5% - 5.6% 391,569 18.6% n/a n/a 2016; disconnections for non-payment only Iowa 1,827,028 433,787 34,505 1.9% 0.3% - 3.4% 300,628 16.5% n/a n/a 2016; involuntary disconnections only Lifeline Program Customers (Low-Income) Utah 770,553 578,854 3,932 0.5% 0.5% n/a n/a 2% 2016 Data only available during winter moratorium (November 1, 2015 - April 1, 2016); disconnections for non-payment only Montana 573,199 n/a 1,986 0.3% 0.0% - 0.4% n/a na n/a n/a Data only available May 1, 2016 to November 1, 2016 (other months are protected by moratorium) Connecticut n/a n/a n/a n/a n/a n/a n/a Hardship Customers 9.4% Data only available during winter moratorium (November 2016 - April 2016); disconnections INCLUDES vacant properties Wsconsin n/a 65,917 n/a n/a n/a n/a n/a New Hampshire 7,612,310 379,971 33,531 0.4% 0.5% - 0.1% n/a n/a n/a n/a 2016; disconnections for non-payment only 2016 **Disconnections only includes partial data because provided voluntary (and inconsistently) by utility companies. Kansas 1,600,663 824,853 67,285** n/a n/a 338,103 0 n/a n/a Data only available January - November 2015. Disconnection notices, disconnections, and reconnections include both residential and commercial accounts. Nevada 1,213,927 1,779,321 187,775 n/a n/a n/a na n/a n/a
Whats not in the table? At least 14 states do not count or report any data on shutoffs Some states count and report: Shutoffs for nonpayment Shutoffs for nonpayment and voluntary shutoffs Shutoffs for vulnerable groups Shutoffs during moratorium Shutoffs during months outside of moratorium Multiple shutoffs due to pre-pay programs Residential and commercial accounts Most recent data available is from 2012 2016 Include vacant properties among shutoff numbers
State Disconnection Rates 2016 9% AZ, 8.0% 8% ME, 7.5% 7% WA, 5.4% CA, 5.2% 6% NC, 5.1% DC, 5.1% 5% MD, 4.9% PA, 4.2% 4% IL, 3.9% MA, 3.5% NY, 2.5% 3% MN, 2.4% CO, 2.0% 2% IA, 1.9% UT, 0.5% 1% NH, 0.4% MT, 0.3% 0%
X Disconnection Rate = Average Total Accounts Thank You! Gabriela Sandoval, Ph.D. gsandoval@turn.org 415.929.8876 turn.org
