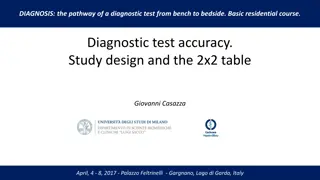
Diagnostic Test Accuracy: A Practical Overview
The receiver operating characteristic (ROC) curve
April, 4 - 8, 2017 - Palazzo Feltrinelli - Gargnano, Lago di Garda, Italy
Giovanni Casazza
Outline
DIAGNOSIS: the pathway of a diagnostic test from bench to bedside. Basic residential course.
Effect of cut-off variation on sensitivity and specificity
Graphical representation of the relationship between sensitivity and specificity (ROC curve)
A summary measure of the overall accuracy (AUC)
Reading a ROC curve
Outline
Spleen stiffness: continuous measurement
A diagnostic accuracy study: spleen sriffness
n=36
n=24
Continuous index test results
23/24 test +
1/24 test –
Sensitivity: 23/24=95.8%
Continuous index test results
n=36
n=24
8/36 test +
28/36 test –
Specificity: 28/36=77.8%
Continuous index test results
n=36
n=24
8/36 test +
28/36 test –
Specificity: 28/36=77.8%
Continuous index test results
n=36
n=24
23/24 test +
1/24 test –
Sensitivity: 23/24=95.8%
FP
TP
TN
FN
0/36 test +
36/36 test –
6/24 test +
18/24 test –
3.95
Specificity: 36/36=100%
Sensitivity: 6/24=25%
Continuous index test results
n=36
n=24
1/36 test +
35/36 test –
9/24 test +
15/24 test –
3.75
Specificity: 35/36=97.2%
Sensitivity: 9/24=37.5%
Continuous index test results
n=36
n=24
1/36 test +
35/36 test –
11/24 test +
13/24 test –
3.68
Specificity: 35/36=97.2%
Sensitivity: 11/24=45.8%
Continuous index test results
n=36
n=24
2/36 test +
34/36 test –
15/24 test +
9/24 test –
3.59
Specificity: 34/36=94.4%
Sensitivity: 15/24=62.5%
Continuous index test results
n=36
n=24
14/36 test +
22/36 test –
23/24 test +
1/24 test –
3.25
Specificity: 22/36=61.1%
Sensitivity: 23/24=95.8%
Continuous index test results
n=36
n=24
26/36 test +
10/36 test –
24/24 test +
0/24 test –
3.00
Specificity: 10/36=27.8%
Sensitivity: 24/24=100%
Continuous index test results
n=36
n=24
18/36 test +
18/36 test –
24/24 test +
0/24 test –
3.15
Specificity: 18/36=50%
Sensitivity: 24/24=100%
Continuous index test results
n=36
n=24
The threshold
The threshold
Summary of thresholds - Table
As the cut-off increases:
only patients with higher SS values are classified
as positive.
Less (true and false) positive patients;
more (true and false) negative patients.
Less true positives
Sensitivity decreases
Less false positives
Specificity increases
Sens=TP/(TP+FN)
Spec=TN/(TN+FP)
Unfortunately, as specificity increases, sensitivity decreases.
Trade-off between sensitivity and specificity
As the cut-off decreases:
only patients with lower SS values are classified
as negatives.
Less (true and false) negative patients;
more (true and false) positive patients.
Unfortunately, as sensitivity increases, specificity decreases.
Trade-off between sensitivity and specificity
More true positives
Sensitivity increases
More false positives
Specificity decreases
Sens=TP/(TP+FN)
Spec=TN/(TN+FP)
1.0
0.9
0.8
0.7
0.6
0.5
0.4
0.3
0.2
0.1
0
Specificity
Cut
-
off
value
Sensitivity
Specificity
1
-
specificity
3.95
0.250
1.000
0.000
3.75
0.375
0.972
0.028
3.68
0.458
0.972
0.028
3.59
0.625
0.944
0.056
3.36
0.958
0.778
0.222
3.25
0.958
0.611
0.389
3.15
1.000
0.500
0.500
3.00
1.000
0.278
0.722
Summary of thresholds - Graphic
If we do the same for all the possible
cut-off values
Summary of thresholds - Graphic
The ROC curve
This curve is known as the Receiver
Operating Characteristic (ROC) curve.
1.0
0.9
0.8
0.7
0.6
0.5
0.4
0.3
0.2
0.1
0.0
Specificity
cut-off: 3.36
Sens=0.958
Spec=0.778
cut-off: 3.59
Sens=0.625
Spec=0.944
The ROC curve
1.0 0.9 0.8 0.7 0.6 0.5 0.4 0.3 0.2 0.1 0
The ROC curve
The area under the ROC curve (AUC) is a
(summary) measure of diagnostic
accuracy
AUC=0.937
AUC is a measure of the ability of the
continuous index test to discriminate
between diseased and non diseased
The ROC curve
Inidividual patients plot
Box plot
The ROC curve
HVPG vs LS for a Target Condition: which of the two has the higher AUC?
The ROC curve
Platelet count/spleen diameter ratio: proposal and validation of a non-invasive parameter to predict the presence of oesophageal varices in patients with liver cirrhosis
Gut 2003;52:1200–1205
The perfect test: sensitivity and specificity both 100%.
The ROC curve
The worthless test … like flipping a coin.
LR+=1 for each point of the curve
LR -=1 for each point of the curve
What is the value of LRs?
The ROC curve
1.0 0.9 0.8 0.7 0.6 0.5 0.4 0.3 0.2 0.1 0
A new index test with sensitivity 99% and specificity 1%.
Is that test useful for … … ?
0.99
0.01
The ROC curve
Reading the results of a study
Correlation of platelets count with endoscopic findings in a cohort of Egyptian patients with liver cirrhosis
Medicine (2016) 95:23
Reading a ROC curve
Choosing the cut-off value
The ROC curve
Assess if the test is (and how much is) useful to rule-in or to rule-out the target condition.
The ROC curve as a summary of the pairs (sensitivity, specificity) at each cut-off.
Do not give too much importance to the value of AUC: “read” the whole curve.
AUC may be useful to compare the overall accuracy of two or more tests
Take home points
Navigate through the pathway of diagnostic test development, implementation, and evaluation from bench to bedside. Explore the Receiver Operating Characteristic (ROC) curve, the impact of cut-off variations on sensitivity and specificity, and the practical application of continuous measurement in diagnostic accuracy studies. Gain insights into interpreting ROC curves, analyzing sensitivity and specificity results, and understanding the interplay between true positive, true negative, false positive, and false negative results.

Download Presentation

Please find below an Image/Link to download the presentation.
The content on the website is provided AS IS for your information and personal use only. It may not be sold, licensed, or shared on other websites without obtaining consent from the author.If you encounter any issues during the download, it is possible that the publisher has removed the file from their server.
You are allowed to download the files provided on this website for personal or commercial use, subject to the condition that they are used lawfully. All files are the property of their respective owners.
The content on the website is provided AS IS for your information and personal use only. It may not be sold, licensed, or shared on other websites without obtaining consent from the author.
E N D
Presentation Transcript
Outline DIAGNOSIS: the pathway of a diagnostic test from bench to bedside. Basic residential course. The receiver operating characteristic (ROC) curve Giovanni Casazza April, 4 - 8, 2017 - Palazzo Feltrinelli - Gargnano, Lago di Garda, Italy
Outline Effect of cut-off variation on sensitivity and specificity Graphical representation of the relationship between sensitivity and specificity (ROC curve) A summary measure of the overall accuracy (AUC) Reading a ROC curve
A diagnostic accuracy study: spleen sriffness Spleen stiffness: continuous measurement
Continuous index test results Test + Test n=36 n=24
Continuous index test results Test + Sensitivity: 23/24=95.8% 23/24 test + 1/24 test Test n=36 n=24
Continuous index test results Test + Specificity: 28/36=77.8% 8/36 test + 28/36 test Test n=36 n=24
Continuous index test results Sensitivity: 23/24=95.8% Test + Specificity: 28/36=77.8% 8/36 test + 28/36 test Any EV + FP TP + 23 8 31 1 28 29 TN FN Tot 24 36 23/24 test + 1/24 test Test n=36 n=24
Continuous index test results Sensitivity: 6/24=25% Specificity: 36/36=100% 0/36 test + 36/36 test 6/24 test + 18/24 test 3.95 n=36 n=24
Continuous index test results Sensitivity: 9/24=37.5% Specificity: 35/36=97.2% 1/36 test + 35/36 test 9/24 test + 15/24 test 3.75 n=36 n=24
Continuous index test results Sensitivity: 11/24=45.8% Specificity: 35/36=97.2% 1/36 test + 35/36 test 11/24 test + 13/24 test 3.68 n=36 n=24
Continuous index test results Sensitivity: 15/24=62.5% Specificity: 34/36=94.4% 2/36 test + 34/36 test 15/24 test + 9/24 test 3.59 n=36 n=24
Continuous index test results Sensitivity: 23/24=95.8% Specificity: 22/36=61.1% 14/36 test + 22/36 test 23/24 test + 1/24 test 3.25 n=36 n=24
Continuous index test results Sensitivity: 24/24=100% Specificity: 10/36=27.8% 26/36 test + 10/36 test 24/24 test + 0/24 test 3.00 n=36 n=24
Continuous index test results Sensitivity: 24/24=100% Specificity: 18/36=50% 18/36 test + 18/36 test 24/24 test + 0/24 test 3.15 n=36 n=24
The threshold Any EV Any EV + + + 6 0 6 + 9 1 10 SS >3.95 SS >3.75 18 36 54 15 35 50 Tot 24 36 Tot 24 36 Any EV Any EV + + + 11 1 12 + 15 2 17 SS >3.68 SS >3.59 13 35 48 9 34 43 Tot 24 36 Tot 24 36
The threshold Any EV Any EV + + + 23 8 31 + 23 14 37 SS >3.36 SS >3.25 1 28 29 1 22 23 Tot 24 36 Tot 24 36 Any EV Any EV + + 24 18 42 + 24 26 50 SS >3.15 SS >3.00 0 18 18 0 10 10 Tot 24 36 Tot 24 36
Summary of thresholds - Table Cut-off value Test + Test - Sensitivity Specificity 3.95 6 54 25 100 3.75 10 50 37.5 97.2 3.68 12 48 45.8 97.2 3.59 17 43 62.5 94.4 3.36 31 29 95.8 77.8 3.25 37 23 95.8 61.1 3.15 42 18 100 50 3.00 50 10 100 27.8
Trade-off between sensitivity and specificity Unfortunately, as specificity increases, sensitivity decreases. cut-off pt SS As the cut-off increases: only patients with higher SS values are classified as positive. 3.15 3.59 3.95 3.02 3.14 3.25 3.40 3.65 3.80 3.98 4.05 4.40 1 2 3 4 5 6 7 8 9 - - + + + + + + + - - - - + + + + + - - - - - - + + + Less (true and false) positive patients; more (true and false) negative patients. Less true positives Sensitivity decreases Sens=TP/(TP+FN) Less false positives Specificity increases Spec=TN/(TN+FP)
Trade-off between sensitivity and specificity Unfortunately, as sensitivity increases, specificity decreases. cut-off pt SS As the cut-off decreases: only patients with lower SS values are classified as negatives. 3.15 3.59 3.95 3.02 3.14 3.25 3.40 3.65 3.80 3.98 4.05 4.40 1 2 3 4 5 6 7 8 9 - - + + + + + + + - - - - + + + + + - - - - - - + + + Less (true and false) negative patients; more (true and false) positive patients. More true positives Sensitivity increases Sens=TP/(TP+FN) More false positives Specificity decreases Spec=TN/(TN+FP)
Summary of thresholds - Graphic 1 0.9 Cut-off value value Sensitivity Sensitivity Specificity Specificity 1-specificity Cut-off 0.8 3.95 3.95 0.250 0.250 1.000 1.000 0.000 0.7 3.75 3.75 0.375 0.375 0.972 0.972 0.028 0.6 3.68 3.68 0.458 0.458 0.972 0.972 0.028 Sensitivity 3.59 3.59 0.625 0.625 0.944 0.944 0.056 0.5 3.36 3.36 0.958 0.958 0.778 0.778 0.222 0.4 3.25 3.25 0.958 0.958 0.611 0.611 0.389 0.3 3.15 3.15 1.000 1.000 0.500 0.500 0.500 3.00 3.00 1.000 1.000 0.278 0.278 0.722 0.2 0.1 0 1.0 0 0.1 0.9 0.2 0.8 0.3 0.7 0.4 0.6 0.5 0.5 0.6 0.4 0.7 0.3 0.8 0.2 0.9 0.1 1 0 1-Specificity Specificity
Summary of thresholds - Graphic 1 0.9 If we do the same for all the possible cut-off values 0.8 0.7 0.6 Sensitivity 0.5 0.4 0.3 0.2 0.1 0 1.0 0.9 0.8 0.7 0.6 0.5 0.4 0.3 0.2 0.1 0.0 0 0.1 0.2 0.3 0.4 0.5 0.6 0.7 0.8 0.9 1-Specificity Specificity 1
The ROC curve 1 0.9 0.8 This curve is known as the Receiver Operating Characteristic (ROC) curve. 0.7 0.6 Sensitivity 0.5 0.4 0.3 0.2 0.1 0 1.0 0.9 0.8 0.7 0.6 0.5 0.4 0.3 0.2 0.1 0.0 0 0.1 0.2 0.3 0.4 0.5 0.6 0.7 0.8 0.9 1-Specificity Specificity 1
The ROC curve 1 cut-off: 3.36 Sens=0.958 Spec=0.778 0.9 0.8 0.7 cut-off: 3.59 Sens=0.625 Spec=0.944 0.6 Sensitivity 0.5 0.4 0.3 0.2 0.1 0 1.0 0.9 0.8 0.7 0.6 0.5 0.4 0.3 0.2 0.1 0.0 0 0.1 0.2 0.3 0.4 0.5 0.6 0.7 0.8 0.9 1-Specificity Specificity 1
The ROC curve 1 The area under the ROC curve (AUC) is a (summary) measure of diagnostic accuracy 0.9 0.8 0.7 0.6 AUC is a measure of the ability of the continuous index test to discriminate between diseased and non diseased AUC=0.937 0.5 0.4 0.3 0.2 0.1 0 1.0 0.9 0.8 0.7 0.6 0.5 0.4 0.3 0.2 0.1 0 0 0.1 0.2 0.3 0.4 0.5 0.6 0.7 0.8 0.9 1
The ROC curve Inidividual patients plot Box plot
The ROC curve HVPG vs LS for a Target Condition: which of the two has the higher AUC?
The ROC curve Platelet count/spleen diameter ratio: proposal and validation of a non-invasive parameter to predict the presence of oesophageal varices in patients with liver cirrhosis Gut 2003;52:1200 1205
The ROC curve The perfect test: sensitivity and specificity both 100%. 1.0 0.9 0.8 0.7 0.6 0.5 0.4 0.3 0.2 0.1 0
The ROC curve Is that test useful for ? A new index test with sensitivity 99% and specificity 1%. The worthless test like flipping a coin. What is the value of LRs? LR+=1 for each point of the curve LR -=1 for each point of the curve 0.99 1.0 0.9 0.8 0.7 0.6 0.5 0.4 0.3 0.2 0.1 0 0.01
The ROC curve Correlation of platelets count with endoscopic findings in a cohort of Egyptian patients with liver cirrhosis Medicine (2016) 95:23 Reading the results of a study
The ROC curve Reading a ROC curve Choosing the cut-off value
Take home points The ROC curve as a summary of the pairs (sensitivity, specificity) at each cut-off. Do not give too much importance to the value of AUC: read the whole curve. Assess if the test is (and how much is) useful to rule-in or to rule-out the target condition. AUC may be useful to compare the overall accuracy of two or more tests