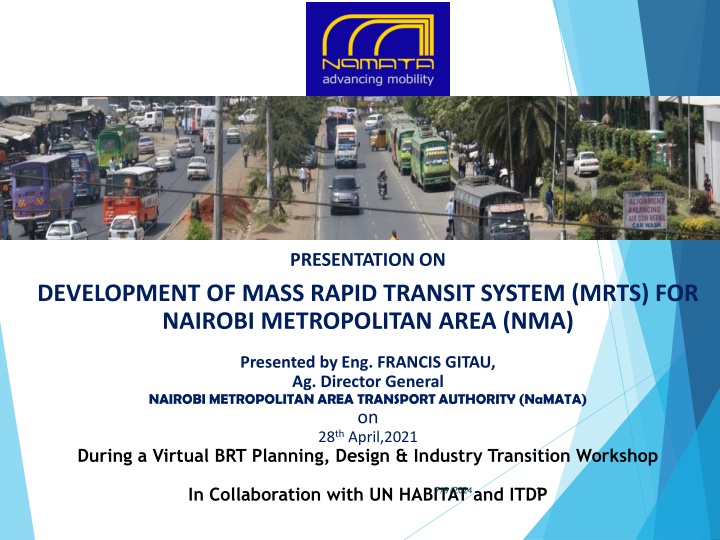
Development of Mass Rapid Transit System (MRTS) for Nairobi Metropolitan Area
Eng. Francis Gitau from NaMATA presented an overview of the history of Nairobi, planning considerations, challenges, population growth, and future transportation strategies during a virtual workshop. The presentation highlighted the need for a comprehensive public transport strategy to address the increasing travel demand in the Nairobi Metropolitan Area by 2030.

Download Presentation

Please find below an Image/Link to download the presentation.
The content on the website is provided AS IS for your information and personal use only. It may not be sold, licensed, or shared on other websites without obtaining consent from the author.If you encounter any issues during the download, it is possible that the publisher has removed the file from their server.
You are allowed to download the files provided on this website for personal or commercial use, subject to the condition that they are used lawfully. All files are the property of their respective owners.
The content on the website is provided AS IS for your information and personal use only. It may not be sold, licensed, or shared on other websites without obtaining consent from the author.
E N D
Presentation Transcript
PRESENTATION ON DEVELOPMENT OF MASS RAPID TRANSIT SYSTEM (MRTS) FOR NAIROBI METROPOLITAN AREA (NMA) Presented by Eng. FRANCIS GITAU, Ag. Director General NAIROBI METROPOLITAN AREA TRANSPORT AUTHORITY (NaMATA) on 28th April,2021 During a Virtual BRT Planning, Design & Industry Transition Workshop In Collaboration with UN HABITAT and ITDP 1 7/9/2024
PRESENTATION OUTLINE 1. Overview ON THE HISTORY OF NAIROBI 2. Planning Nairobi Overview and Justification For MRTS 3. Identified Challenges 4. Nairobi Metropolitan Area 5. Nairobi Metropolitan Area Population 6. Travel Demand forecast 2030 7. Nairobi metropolitan transport authority (nAmata) 8. Public transport strategy 9. Modal share 10. Snippet on Commuter Rail Services 11. THANK YOU 7/9/2024 2
Nairobi Overview Started in 1899 as Transport Hub on a Railway Depot(Halliman and Morgan 1977) confirmed in 1905 and in 1907capital of Kenya, with confirmed in 1905 and in 1907capital of Kenya, with a population of 10,000 people a population of 10,000 people 1919, Nairobi became a municipality with corporate rights and defined by an area extending 1.5 miles (3.9 Km); population15,000 1950 Nairobi granted city status with an area of 90 sq. Km extended further to cover 690 sq. Km. 1948 master plan for a colonial city recommended a compact CBD with a road system that gives access to through traffic as well as into the suburbs and industrial area. 7/9/2024 3
Nairobi Overview Growth of the town were controlled more by economic forces, with no co-ordination of development; gridiron street pattern in the center Land use development was fixed within this racial influence (Africans, Asians and Europeans) African (bulk population) residential areas towards the East, away from the major trunk road 1963 with the influx of migrants into the city when colonial restrictions on Africans were repealed (squater settlements sited near the CBD like Pumwani) 1970's population distribution; Phasing out squatter settlements near the CBD, introduction of site and service schemes like Dandora and Kayole. Sprawling settlements; Kibera, Soweto and quarry emerge city not matched expansion in public transport facilities and services; beginning of the conflict and stampede in public transport currently being witnessed in the CBD area 4 7/9/2024
Planning Nairobi-History Nairobi Municipal Council engages a town planning consultant team in 1926 to - re-order City (locate workers within walking distance to the CBD and industrial area) 1929 traffic problems - discussion by the Nairobi Municipal Council, parking and overspeeding (Hake 1977 pp.22) Need for public transport - population growth.1934 inauguration of Nairobi town bus services, 2 buses followed by an agreement with British transport company (U.T.O.) to provide urban public transport services, (exclusive franchise) This was the origin of the present Kenya bus services. slow growth-1950; only 12 buses serving mainly Asian and European areas with good access roads both within itself and to the town centre (Stren and White 1989) neglect of African public transport needs; emergence in the 1950's of 'Matatu' used within the African areas to the nearby rural villages and to carry foodstuffs from rural areas 5 7/9/2024
Planning Nairobi-History Master plan for Nairobi Municipality, commissioned in 1948;first plan for the city. Guidelines for the development of Nairobi for the next twenty years Zoning; residential and industrial areas, extension for the road network and the commercial areas of the town Present layout of Nairobi's CBD area Prior to 1948, the CBD was had large open spaces which the plan proposed, to be filled up and the CBD area; be prevented from spreading beyond Nairobi river in the North and the railway line in the South - compact area Proposed a road system within the CBD with freedom of through traffic and easy exit for traffic into the city's suburbs and industrial area (access is to the west - of Uhuru Highway and its associated junctions on University way, City Hall way, Kenyatta Avenue, Haile Selassie Avenue, to the East - Race Course Road and Landhies road (inadequate means of traffic circulation; today large traffic volume transverse the CBD even without any business) 6 7/9/2024
Planning Nairobi-History 1970 commissioning of Nairobi urban study group (N.U.S.G.) which culminated in the 1973 Nairobi Metropolitan growth strategy proposed decentralization of industry to the outskirt; Dandora, Ruaraka, Dagoretti to achieve integration of work and housing areas Report did not provide a planning framework to address issue nor programmes for implementation recommended use of public service vehicles especially buses, as a measure to relieve congestion o NCC 1974 report 6.04 Km (26.6%) of the CBD area road VCR of 1.0; saturated point. 29.2% , 0,7 to 1.0 approaching-saturation levels Most affected streets; Haile Selassie avenue, Tom Mboya Street, River Road, Kenyatta Avenue and Racecourse Road serving as service as well as local distributors 7 7/9/2024
Planning Nairobi-History N.U.S.G. ommitted the 'Matatu' sector role in public transport; emphasised development of buses operating on exclusive bus ways, a commuter rail transit system and the staggering of working hours 1973 President Kenyatta issued a decree legalizing Matatu' sector and exemption from T.L.B. regulations (Stren and While 1989) 1978, Nairobi City Council set up a transport unit; control of both public and private transport, parking supply and control of traffic circulation Feasibility study on bus ways; recommended constructing a 27.7 Km of bus priority lanes to provide efficient transport (though there already existed a system of bus routes and bus layby) N.C.T.U.'s response to public transport needs, too slow to meet demand 8 7/9/2024
Planning Nairobi-History Belgium Transurb consult group (1984) highlighted three options to mass transportation problems in Nairobi. use of exclusive bus ways, introduction of light rail transit system, introduction of articulated bus system 1986 provisional report analysis of supply and demand of Nairobi's public transport. population at 1,505,000 in 1990; 2,525,000 by 2000, (growth rate of +4.5%) projected wage employment potential at 417,400 in 1990 and 658,900 in 2000. estimated daily passenger journeys growth rate to rise from 29.1% in the 1985- 1990 period to 59.6% in the 1990-2000 period identified three basic problems needing urgent attention. Congestion-roads not being adapted to traffic intensity, parking (illegal parking causing obstruction) and lack of staggering of peak hours, lack of by-passes- 67% of vehicles passing through the CBD was through traffic. 9 7/9/2024
Planning Nairobi-History Source: Source: Transurb Transurb Report pg. 48 Report pg. 48 Table 1 Table 1 Projection Projection of of Year Year K.B.S. K.B.S. 1985 1985 1990 1990 2000 2000 Public Public Transport Transport P Passenger assenger Journeys Journeys Passengers by Mode Passengers by Mode Total Total 304,000 304,000 397,000 397,000 760,000 760,000 per Day per Day Matatu Matatu 372,000 372,000 476,000 476,000 633,000 633,000 676,000 676,000 873,000 873,000 1,393,000 1,393,000 10 7/9/2024
Planning Nairobi-History An inventory of completed and ongoing knowledge and implementation support products in urban mobility to date is well captured on pages 47, 48 and 49 0f the Technical Note titled Road Map for Long-term Engagement in the Urban Transport Sector in Kenya Urban Mobility for All published in June 2020, prepared under the Urban Transport Policy Dialogue (P172218) to define strategies to advance sustainable urban transport in Kenya through the enhanced dialogue with the Government of Kenya as well as stakeholders 11 7/9/2024
Challenges Expansion both in size, of population and density of activities, zonal inaccessibility, delays, unreliability of vehicles and inadequacy/total absence of the supportive facilities for the movements within and about the urban area ..metropolitan cities of developed nations like Toronto (Canada) may point to urban transit subway system as having solved most of their urban transportation problems, the majority of developing countries may not afford one due to their levels of technology and development (Soberman R.M: 69). Early urban planning focused on road traffic and the future transport demands forecastedT. he problem was seen as that of traffic congestion, and the solution was building more roads or expansion of the existing ones. ..However they were soon filled up with newly generated traffic and the problem continued Meyer and Hillman (1979:343). 1973 the Minister of Transport allowed any vehicle owner, private or public of any class to operate as passenger carrier provided the vehicle was 3 tons tare weigh or its passenger capacity 15 seats and below, Exempting them from T.L.B. regulations - operational advantage 12 7/9/2024
Challenges ..Public Transport left as free market where any individuals, groups, co- operatives or companies can venture into so long as they comply with statutory and other legal requirements as provided in the legislative statutes . Otieno Charles-konyango 1990 The government attempted and failed(1986) with the actual acquisition, operation and management of public service 'Matatus' not integrated with buses, to offer complementary services, current competition on the roads between Matatus and buses on one hand and between Matatus themselves Bus stops located on the major traffic routes where the volume capacity ratio's are above saturation levels during the peak hour and are well above average during the off peak hours at points of traffic and points of convergence, often adjacent to or sandwiched in between two close junctions 13 7/9/2024 congestion situation blocking entire channel space takes considerable time to clear
Challenges Inadequate termini and stops capacity; frequency of arrival not matched by their frequency of departure Operations unregulated; no time tables/schedules, tendency to remain long enough to pick up 'sufficient' number of passengers before taking off Mode of boarding vehicles delays/scramble/door, duality of use, boarding/alighting Alighting/Boarding in places other than bus stops or terminals, at traffic jams or traffic lights Majority of private vehicles in the CBD, high growth rate of private vehicles Traffic lights on major junctions that are conceived as trouble spots in the traffic flow, cause significant and variable delay Inadequate records on number of Matatus operating on each route and their terminal; in the absence of any policy regulation, or regulation by their association, the Matatus do not operate on a fixed route; some operate long distance services during off peak hours; return to intra- urban service in the peak hours 14 7/9/2024
Challenges Mismatch between the demand and supply of space (road space, lay-by space at bus stops, and terminals' space Lack of adequate waiting space at the bus stops . to accommodate the huge number of passengers particularly in the peak hour (no shelter, rain stampede..) Traffic management, safety aspects, The problem of traffic flow identified as the major cause of delays, frustrations and accidents on the roads 15 7/9/2024
NAIROBI METROPOLITAN AREA Murang a Kiambu Nairobi City Machakos Kajiado 7/9/2024 16
NAIROBI METROPOLITAN AREA POPULATION Population (2019) Area (KM2) Density (P/KM2) COUNTY % % Nairobi 4,397,073 42.2% 694.9 2.1% 6,328 Kiambu 2,417,735 23.2% 2,449.2 7.5% 987 Kajiado 1,117,840 10.7% 21,292.7 65.1% 52 Machakos 1,421,932 13.7% 5,952.9 18.2% 239 Muranga 1,056,640 10.1% 2,325.8 7.1% 454 Totals 10,411,220 100.0% 32,715.5 100.0% 7/9/2024 318 17
TRAVEL DEMAND WITHIN NAIROBI - 2030 Travel Demand Within Nairobi - 2030 Travel Demand Within Nairobi - 2010 637,000 7/9/2024 18 Average Daily Passenger Traffic along major corridors in 2030
Establishment of NaMATA Legal Notice No. 18 of 17th February, 2017 established NaMATA Mandate To oversee the establishment of an integrated, efficient, effective and sustainable public transport system within the Nairobi Metropolitan Area. 7/9/2024 19
Functions of NaMATA NaMATA aims at Develop a sustainable integrated Public Transport Strategy Develop a SUMP Development of a sustainable MRTS Plan, regulate and coordinate the supply of adequate and effective MRTS Formulate strategies to ensure overall improvement in traffic flow and traffic management Develop appropriate and sustainable funding mechanisms 7/9/2024 20
Functions of NaMATA Facilitate integration of transport and land use planning Conduct studies and research Regulate on and off street parking on declared roads 7/9/2024 21
Public Transport Strategy The Mass Rapid Transit System of Nairobi comprises: Commuter Rail (CR) Bus Rapid Transit (BRT) Integration of transport modes Integrated ticketing system Real-time Passenger Information System (PIS) Combined, CR and BRT offer a fast transport network for the entire NMA and sufficient capacity for the increasing number of commuters. Provide seamless transport: Network integration: providing access to transport in the entire NMA and providing fast connections on main corridors. Interchanges: well-designed interchange stations where CR, BRT and Matatus provide for easy transfer. Fare and ticket integration: one ticket from travelling in the NMA (used by all operators) and one fare structure in which one pays for the entire journey (instead of paying twice to different operators). 22 7/9/2024
7/9/2024 23
NAIROBI MODE SHARE-2004/2013 Walk 2013 39.7% 5.4% 13.5% 28.4% 12.2% Two-wheel Mode Private car/ Taxi/Truck 1.2% 2004 47.1% 15.3% 29.0% 6.8% Matatu Bus 0% 20% 40% 60% 80% 100% Source: JICA Study Team (JST) For effective utilisation of road space we must focus on Public Transport and Non-Motorised Transport that account for between 80 to 90 percent of all trips 7/9/2024 24 24
Demand forecast/fleet CRS 2030; all existing lines that currently have a commuter rail service, extensions over existing railway alignments and two of the most promising new alignments, to Ngong and JKIA. This 2030 Core Scenario would be Phase 1 of the Commuter Rail Master Plan, with all implementation proposed to take place by the year 2030. Total forecast demand for commuter rail is 127,000 in the AM peak, and an estimated 1.4 million per weekday. The strongest demand, in the morning peak hour is over the Ruiru Central section. \ Total length of 163 km and 53 stations. The longest line is Nairobi Central-Thika (57 km) and the shortest is Nairobi Central - Embakasi Village (13 km). To meet passenger demand in 2030, the fleet will consist of 89 Diesel Multiple Units (DMUs), each formed of eight cars. Each train can carry 1,200 passengers. 25 7/9/2024
Commuter Rail Master Plan 2030 Core Scenario 7/9/2024 26
THANK YOU 7/9/2024 27