Decisions Under Risk and Uncertainty
 undefined
Decisions Under Risk and Uncertainty

Risk vs. Uncertainty
•
Risk
–
Must make a decision for which the outcome is
not known with certainty
–
Can list all possible outcomes & assign
probabilities to the outcomes
•
Uncertainty
–
Cannot list all possible outcomes
–
Cannot assign probabilities to the outcomes
Measuring Risk
Probability Distributions
•
Probability
–
Chance that an event will occur
•
Probability Distribution
–
List of all possible events and the probability that each will
occur
–
probability distribution is essential in evaluating and
comparing investment projects
•
Expected Value or Expected Profit
Probability Distribution for Sales
Expected Value
•
Expected value (or mean) of a probability
distribution is:
Where
X
i
is the
i
th
outcome of a decision,
p
i
is the probability of the
i
th
outcome, and
n
is
the total number of possible outcomes
Measuring Risk
Probability Distributions
Calculation of Expected Profit
Expected profit of an investment is the weighted average of all possible profit
levels that can result from the investment under the various state of the
economy, with the probability of those outcomes or profits used as weights.
Expected Value
•
Does not give actual value of the random
outcome
–
Indicates “average” value of the outcomes if the
risky decision were to be repeated a large
number of times
Variance
•
Variance is a measure of absolute risk
–
Measures dispersion of the outcomes about the
mean or expected outcome
•
The higher the variance, the greater the
risk associated with a probability
distribution
Measuring Risk
Probability Distributions
Calculation of the Standard Deviation
Project A
Measuring Risk
Probability Distributions
Calculation of the Standard Deviation
Project B
Identical Means but Different Variances
Standard Deviation
•
Standard deviation is the square root of the
variance
•
The higher the standard deviation, the
greater the risk
Probability Distributions with Different
Variances
Coefficient of Variation
•
When expected values of outcomes differ
substantially, managers should measure
riskiness of a decision relative to its expected
value using the coefficient of variation
–
A measure of relative risk
Decisions Under Risk
•
No single decision rule guarantees profits
will actually be maximized
•
Decision rules do not eliminate risk
–
Provide a method to systematically include risk
in the decision making process
Which Rule is Best?
•
For a repeated decision, with identical
probabilities each time
–
Expected value rule is most reliable to
maximizing (expected) profit
–
Average return of a given risky course of action
repeated many times approaches the expected
value of that action
Expected Utility Theory
•
Actual decisions made depend on the
willingness to accept risk
•
Expected utility theory allows for different
attitudes toward risk-taking in decision
making
–
Managers are assumed to derive utility from
earning profits
Expected Utility Theory
•
Managers make risky decisions in a way that
maximizes expected utility of the profit
outcomes
•
Utility function measures utility associated
with a particular level of profit
•
Index to measure level of utility received for a
given amount of earned profit
Manager’s Attitude Toward Risk
•
Determined by the manager’s marginal
utility of profit:
•
Marginal utility (slope of utility curve)
determines attitude toward risk
Manager’s Attitude Toward Risk
•
Risk averse
–
If faced with two risky decisions with equal
expected profits, the less risky decision is
chosen
•
Risk loving
–
Expected profits are equal & the more risky
decision is chosen
•
Risk neutral
–
Indifferent between risky decisions that have
equal expected profit
Manager’s Attitude Toward Risk
•
Can relate to marginal utility of profit
•
Diminishing
MU
profit
–
Risk averse
•
Increasing
MU
profit
–
Risk loving
•
Constant
MU
profit
–
Risk neutral
Manager’s Attitude Toward Risk
Manager’s Attitude Toward Risk
Manager’s Attitude Toward Risk
•
Value of the Firm = Net Present Value
r is appropriate discount rate
We will extend this model to deal with an investment project subject
to risk.
Two commonly used methods . 1 Risk-Adjusted Discount Rate
2 Certainty Equivalent Approach
Adjusting Value for Risk
This reflects the managers /investors trade off between risk and return.
Risk measured by the SD of profits/returns
The risk return trade off function of indifference curve ( R) shows that
the manager is indifferent among a 10 % rate of return on a riskless
asset with SD = 0 ( point A)
20% rate of return with SD =1 (Point C)
32% with SD 1.5 (point D)
Difference between the expected rate of return on risky project and
riskless project is called risk premium on risky investment
Risk –return trade off function ( R) shows that risk premium of 4% is
required to compensate for the level of risk given by SD = 0.5
Similarly 10% premium required for an investment with SD =1.0
Risk-Adjusted Discount Rate
Adjusting Value for Risk
The risk return trade off curve would be steeper (R’) for
more risk averse manager and less steep (R’’) for a less risk
averse manager
.
More risk –averse manager facing R’ would require a premium of
22%(c’) for project with SD=1, while a less risk –averse manager with
R’’ would require a risk premium of only 4% for the same investment
R= net cash flow or return
C= initial cost of investment
Project is undertaken if its NPV greater than or equal
to zero, or larger than that for an alternative project
There is a project with expected net cash flow /return 45,000 for the
next five years and initial cost 100,000.
Risk adjusted discount rate is 20%
Then , we have
If firm perceived this as much risky project and used 32% as k its NPV
would be
Adjusting Value for Risk
Certainty Equivalent Approach
Certainty Equivalent Coefficient
This modifies the numerator of the valuation model
Here R is risky net cash flow
r is risk free discount rate
α
is certainty equivalent coefficient
The investor must specify the certain sum that yields to him same utility
or satisfaction of the expected risky sum from the investment. The
value of
α
ranges from 0 to 1.
0 means too risky project
1 means risk free project
If the manager regarded the sum of 36000 with certainty as equivalent
to the expected (risky) net cash flow of 45000 per year for the next
five years
therefore
α
= 36000/45000= 0.8
Take 10% as risk free discount rate
Then NPV would be
If firm perceived this as much more risky and applied 0.62 as certainty
equivalent coefficient the NPV would be 5,763.32.
These answers are closed to those under previous method
Manager’s Utility Function for Profit
Expected Utility of Profits
•
According to expected utility theory, decisions
are made to maximize the manager’s expected
utility of profits
•
Such decisions reflect risk-taking attitude
–
Generally differ from those reached by decision
rules that do not consider risk
–
For a risk-neutral manager, decisions are identical
under maximization of expected utility or
maximization of expected profit
Decisions Under Uncertainty
•
With uncertainty, decision science provides
little guidance
–
Four basic decision rules are provided to aid
managers in analysis of uncertain situations
Summary of Decision Rules Under
Conditions of Uncertainty
Identify best outcome for each possible decision &
choose decision with maximum payoff.
Determine worst potential regret associated with each
decision, where potential regret with any decision &
state of nature is the improvement in payoff the
manager could have received had the decision been the
best one when the state of nature actually occurred.
Manager chooses decision with minimum worst
potential regret.
Assume each state of nature is equally likely to occur &
compute average payoff for each. Choose decision with
highest average payoff.
Identify worst outcome for each decision & choose
decision with maximum worst payoff.
•
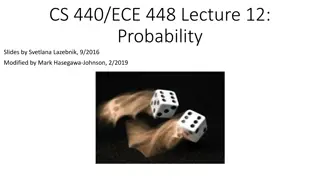
Decision Trees
–
Sequence of possible managerial decisions and
their expected outcomes
–
Conditional probabilities
Uncertainty
•
Maximin Criterion
–
Determine worst possible outcome for each
strategy
–
Select the strategy that yields the best of the
worst outcomes
Uncertainty: Maximin
The payoff matrix below shows the payoffs from
two states of nature and two strategies.
Uncertainty: Maximin
The payoff matrix below shows the payoffs from
two states of nature and two strategies.
For the strategy “Invest” the worst outcome is a
loss of 10,000. For the strategy “Do Not Invest” the
worst outcome is 0. The maximin strategy is the
best of the two worst outcomes - Do Not Invest.
Uncertainty: Minimax Regret
The payoff matrix below shows the payoffs from
two states of nature and two strategies.
Uncertainty: Minimax Regret
The regret matrix represents the difference
between the given strategy and the payoff of the
best strategy under the same state of nature.
Uncertainty: Minimax Regret
For each strategy, the maximum regret is identified.
The minimax regret strategy is the one that results
in the minimum value of the maximum regret.
Uncertainty: Informal Methods
•
Gather Additional Information
•
Request the Opinion of an Authority
•
Control the Business Environment
•
Diversification
Decisions under risk involve outcomes with known probabilities, while uncertainty arises when outcomes and probabilities are unknown. Measuring risk involves probability distributions, expected values, and variance calculations. Expected profit is determined by weighting profits with respective probabilities under different economic states. The concept of variance indicates the level of absolute risk associated with a probability distribution.

Download Presentation

Please find below an Image/Link to download the presentation.
The content on the website is provided AS IS for your information and personal use only. It may not be sold, licensed, or shared on other websites without obtaining consent from the author.If you encounter any issues during the download, it is possible that the publisher has removed the file from their server.
You are allowed to download the files provided on this website for personal or commercial use, subject to the condition that they are used lawfully. All files are the property of their respective owners.
The content on the website is provided AS IS for your information and personal use only. It may not be sold, licensed, or shared on other websites without obtaining consent from the author.
E N D
Presentation Transcript
Risk vs. Uncertainty Risk Must make a decision for which the outcome is not known with certainty Can list all possible outcomes & assign probabilities to the outcomes Uncertainty Cannot list all possible outcomes Cannot assign probabilities to the outcomes
Measuring Risk Probability Distributions Probability Chance that an event will occur Probability Distribution List of all possible events and the probability that each will occur probability distribution is essential in evaluating and comparing investment projects Expected Value or Expected Profit n ( ) = = E P i i = 1 i
Expected Value Expected value (or mean) of a probability distribution is: n = = = = E( X ) Expected value of X p X i i = = i 1 Where Xi is the ith outcome of a decision, pi is the probability of the ith outcome, and n is the total number of possible outcomes
Measuring Risk Probability Distributions Calculation of Expected Profit Expected profit of an investment is the weighted average of all possible profit levels that can result from the investment under the various state of the economy, with the probability of those outcomes or profits used as weights. State of Economy Boom Normal Recession Expected profit from Project A Probability Outcome Expected (P) ( ) 0.25 $600 0.50 500 0.25 400 Project Value $150 250 100 $500 $200 250 50 $500 A Boom Normal Recession Expected profit from Project B 0.25 0.50 0.25 $800 500 200 B
Expected Value Does not give actual value of the random outcome Indicates average value of the outcomes if the risky decision were to be repeated a large number of times
Variance Variance is a measure of absolute risk Measures dispersion of the outcomes about the mean or expected outcome n = = 2 X 2 Variance(X) = p ( X E( X )) i i = = i 1 The higher the variance, the greater the risk associated with a probability distribution
Measuring Risk Probability Distributions Calculation of the Standard Deviation Project A = (600 500) (0.25) (500 500) (0.50) (400 500) (0.25) + + 2 2 2 = = 5,000 $70.71
Measuring Risk Probability Distributions Calculation of the Standard Deviation Project B = (800 500) (0.25) (500 500) (0.50) (200 500) (0.25) + + 2 2 2 = = 45,000 $212.13
Standard Deviation Standard deviation is the square root of the variance = = Variance( X ) X The higher the standard deviation, the greater the risk
Probability Distributions with Different Variances
Coefficient of Variation When expected values of outcomes differ substantially, managers should measure riskiness of a decision relative to its expected value using the coefficient of variation A measure of relative risk Standard deviation Expected value = = = = E( X )
Decisions Under Risk No single decision rule guarantees profits will actually be maximized Decision rules do not eliminate risk Provide a method to systematically include risk in the decision making process
Which Rule is Best? For a repeated decision, with identical probabilities each time Expected value rule is most reliable to maximizing (expected) profit Average return of a given risky course of action repeated many times approaches the expected value of that action
Expected Utility Theory Actual decisions made depend on the willingness to accept risk Expected utility theory allows for different attitudes toward risk-taking in decision making Managers are assumed to derive utility from earning profits
Expected Utility Theory Managers make risky decisions in a way that maximizes expected utility of the profit outcomes 1 1 E U( ) pU( ) = + = + ) ... + + + + p U( p U( ) n n 2 2 Utility function measures utility associated with a particular level of profit Index to measure level of utility received for a given amount of earned profit
Managers Attitude Toward Risk Determined by the manager s marginal utility of profit: MU = = U( ) profit Marginal utility (slope of utility curve) determines attitude toward risk
Managers Attitude Toward Risk Risk averse If faced with two risky decisions with equal expected profits, the less risky decision is chosen Risk loving Expected profits are equal & the more risky decision is chosen Risk neutral Indifferent between risky decisions that have equal expected profit
Managers Attitude Toward Risk Can relate to marginal utility of profit Diminishing MUprofit Risk averse Increasing MUprofit Risk loving Constant MUprofit Risk neutral
Adjusting Value for Risk Value of the Firm = Net Present Value + n 1(1 = = t NPV t ) r t r is appropriate discount rate We will extend this model to deal with an investment project subject to risk. Two commonly used methods . 1 Risk-Adjusted Discount Rate 2 Certainty Equivalent Approach
Risk-Adjusted Discount Rate This reflects the managers /investors trade off between risk and return. Risk measured by the SD of profits/returns The risk return trade off function of indifference curve ( R) shows that the manager is indifferent among a 10 % rate of return on a riskless asset with SD = 0 ( point A) 20% rate of return with SD =1 (Point C) 32% with SD 1.5 (point D) Difference between the expected rate of return on risky project and riskless project is called risk premium on risky investment Risk return trade off function ( R) shows that risk premium of 4% is required to compensate for the level of risk given by SD = 0.5 Similarly 10% premium required for an investment with SD =1.0
The risk return trade off curve would be steeper (R) for more risk averse manager and less steep (R ) for a less risk averse manager. More risk averse manager facing R would require a premium of 22%(c ) for project with SD=1, while a less risk averse manager with R would require a risk premium of only 4% for the same investment
R= net cash flow or return C= initial cost of investment r RiskPremium = + R + k = NPV of investment project C t t 1 ( ) k Project is undertaken if its NPV greater than or equal to zero, or larger than that for an alternative project
There is a project with expected net cash flow /return 45,000 for the next five years and initial cost 100,000. Risk adjusted discount rate is 20% Then , we have ) 2 . 1 ( 1 = t n R = n = NPV C t t t 45000 = 100000 NPV t 2 . 1 ( ) = t 1 n 1 = 45000 ( ) 100000 NPV t 2 . 1 ( ) 1 = 45000 . 2 ( 9906 ) 100000 NPV = 34577 NPV If firm perceived this as much risky project and used 32% as k its NPV would be 100000 ) 32 . 1 ( 1 = NPV t n 45000 t = NPV t n 1 = 45000 ( ) 100000 t . 1 ( 32 ) = 1 = 100000 45000 3452 . 2 ( ) NPV = 5534 NPV
Adjusting Value for Risk Certainty Equivalent Approach + n R 1(1 = = Certainty Equivalent Coefficient This modifies the numerator of the valuation model t NPV t ) r t Here R is risky net cash flow r is risk free discount rate is certainty equivalent coefficient * t R R equivalentcertainsum expected riskysum = = t The investor must specify the certain sum that yields to him same utility or satisfaction of the expected risky sum from the investment. The value of ranges from 0 to 1. 0 means too risky project 1 means risk free project
If the manager regarded the sum of 36000 with certainty as equivalent to the expected (risky) net cash flow of 45000 per year for the next five years therefore = 36000/45000= 0.8 Take 10% as risk free discount rate n R = n = NPV C t + t ( 1 ) r 1 t Then NPV would be ( 0 8 . )( 45000 ) = t = 100000 NPV t 10 . 1 ( = t ) 1 5 1 = 36000 ( ) 100000 NPV t 10 . 1 ( ) 1 = 36000 ( 7908 . 3 ) 100000 NPV = 36468 80 . NPV If firm perceived this as much more risky and applied 0.62 as certainty equivalent coefficient the NPV would be 5,763.32. These answers are closed to those under previous method
Expected Utility of Profits According to expected utility theory, decisions are made to maximize the manager s expected utility of profits Such decisions reflect risk-taking attitude Generally differ from those reached by decision rules that do not consider risk For a risk-neutral manager, decisions are identical under maximization of expected utility or maximization of expected profit
Decisions Under Uncertainty With uncertainty, decision science provides little guidance Four basic decision rules are provided to aid managers in analysis of uncertain situations
Summary of Decision Rules Under Conditions of Uncertainty Maximax rule Identify best outcome for each possible decision & choose decision with maximum payoff. Maximin rule Identify worst outcome for each decision & choose decision with maximum worst payoff. Minimax regret rule Determine worst potential regret associated with each decision, where potential regret with any decision & state of nature is the improvement in payoff the manager could have received had the decision been the best one when the state of nature actually occurred. Manager chooses decision with minimum worst potential regret. Equal probability rule Assume each state of nature is equally likely to occur & compute average payoff for each. Choose decision with highest average payoff.
Decision Trees Sequence of possible managerial decisions and their expected outcomes Conditional probabilities
Uncertainty Maximin Criterion Determine worst possible outcome for each strategy Select the strategy that yields the best of the worst outcomes
Uncertainty: Maximin The payoff matrix below shows the payoffs from two states of nature and two strategies. State of Nature Strategy Invest Do Not Invest Success 20,000 0 Failure -10,000 0 Maximin -10,000 0
Uncertainty: Maximin The payoff matrix below shows the payoffs from two states of nature and two strategies. For the strategy Invest the worst outcome is a loss of 10,000. For the strategy Do Not Invest the worst outcome is 0. The maximin strategy is the best of the two worst outcomes - Do Not Invest. State of Nature Strategy Invest Do Not Invest Success 20,000 0 Failure -10,000 0 Maximin -10,000 0
Uncertainty: Minimax Regret The payoff matrix below shows the payoffs from two states of nature and two strategies. State of Nature Strategy Invest Do Not Invest Success 20,000 0 Failure -10,000 0
Uncertainty: Minimax Regret The regret matrix represents the difference between the given strategy and the payoff of the best strategy under the same state of nature. State of Nature Regret Matrix Strategy Invest Do Not Invest Success 20,000 0 Failure -10,000 0 Success 0 20,000 Failure 10,000 0
Uncertainty: Minimax Regret For each strategy, the maximum regret is identified. The minimax regret strategy is the one that results in the minimum value of the maximum regret. Maximum Regret 10,000 20,000 State of Nature Regret Matrix Strategy Invest Do Not Invest Success 20,000 0 Failure -10,000 0 Success 0 20,000 Failure 10,000 0
Uncertainty: Informal Methods Gather Additional Information Request the Opinion of an Authority Control the Business Environment Diversification


 for")