Daylight hours maths activity
Dive into the fascinating world of daylight hours and how they change throughout the year. Uncover the reasons behind the varying lengths of days, from the summer's longest to the winter's shortest. Engage in a mathematical activity to analyze the data and make predictions. Stay safe and enjoy the learning journey!

Download Presentation

Please find below an Image/Link to download the presentation.
The content on the website is provided AS IS for your information and personal use only. It may not be sold, licensed, or shared on other websites without obtaining consent from the author.If you encounter any issues during the download, it is possible that the publisher has removed the file from their server.
You are allowed to download the files provided on this website for personal or commercial use, subject to the condition that they are used lawfully. All files are the property of their respective owners.
The content on the website is provided AS IS for your information and personal use only. It may not be sold, licensed, or shared on other websites without obtaining consent from the author.
E N D
Presentation Transcript
Daylight hours maths activity Looking at the way the length of the day changes over the year and predicting the longest and shortest days
Daylight hours maths activity Stay safe Whether you are a scientist researching a new medicine or an engineer solving climate change, safety always comes first. An adult must always be around and supervising when doing this activity. You are responsible for: ensuring that any equipment used for this activity is in good working condition behaving sensibly and following any safety instructions so as not to hurt or injure yourself or others Please note that in the absence of any negligence or other breach of duty by us, this activity is carried out at your own risk. It is important to take extra care at the stages marked with this symbol:
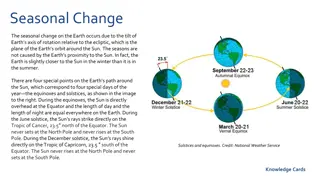
Introduction 1 We live on a planet called Earth. This is where we spend our lives! We work around the way that our planet moves The Earth turns once round every day The Moon goes round the Earth once a month The Earth goes round the sun once every year So, why are the days longer in the summer than the winter?
Introduction 2 The Earth is tilted - this makes it wobble Sometimes it leans into the Sun, but when it gets round to the other side of the Sun it leans away This makes the length of the day change from longest in the summer to the shortest in the winter The longest day in the UK is in our summer - that is when Australia has its shortest day
Resources You will need: Graph paper or the graph paper sheet printed out A pencil and rubber
Step 1 Interpreting the datasheet Look at the datasheet. It shows what time the sun rises and sets at around the middle of each month Because the Earth is tilted these numbers are different for different places. These are for London. The difference between sunset and sunrise is the length of the day.
Datasheet Date 01/01/2021 15/01/2021 01/02/2021 15/02/2021 01/03/2021 15/03/2021 01/04/2021 15/04/2021 01/05/2021 15/05/2021 01/06/2021 15/06/2021 01/07/2021 15/07/2021 01/08/2021 15/08/2021 01/09/2021 15/09/2021 01/10/2021 15/10/2021 01/11/2021 15/11/2021 01/12/2021 15/12/2021 Facts: All times are in the 24 hour clock Times are for London UK Sunrise 08:06 07:59 07:38 07:14 06:45 06:14 06:36 06:05 05:32 05:08 04:49 04:43 04:48 05:01 05:24 05:46 06:13 06:36 07:01 07:25 06:54 07:19 07:44 08:00 Sunset 16:02 16:21 16:05 17:16 17:41 18:05 19:34 19:57 20:24 20:46 21:08 21:19 21:21 21:11 20:48 20:23 19:46 19:15 18:38 18:07 16:33 16:11 15:55 15:52 Length of day 07:56 08:22 08:27 10:02 10:56 11:51 12:58 13:52 14:52 15:38 16:19 16:36 16:33 16:10 15:24 14:37 13:33 12:39 11:37 10:42 09:39 08:52 08:11 07:52
Step 2 Laying out the axes Using the graph (or worksheet) label the dates from the table across the bottom line (X axis) 1-1-21, 15-1-21, 1-2-21 etc Up the side (Y axis), label the number of hours 0 to 24. You can t get less than 0 or more than 24 hours in a day!
Worksheet for the graph 24 23 22 21 20 19 18 17 16 15 14 13 12 11 10 9 8 7 6 5 4 3 2 1 0
Step 3 Plotting the data At every day make a mark at how long the day is Can you see a shape? Try and draw a line through all the points to make a smooth curve
Step 4 Analysing the data Does your data rise and fall across the year? Where is the top of the curve? Where is the bottom? Put a cross where you think the longest day is and where the shortest day is Try and work out the date for these days
Step 5 Checking your result In the Northern hemisphere (top half of the world) the longest day is June 21st The shortest day is December 21st How did you do?
Links Page The source of the data of sunrise and sunset http://www.sunsettimes.co.uk/ Greenwich Observatory https://www.rmg.co.uk/royal-observatory