Crime Research Data Analysis
Breakdown of assault rates and percentages, focusing on different types of assaults such as simple and aggravated. Learn how rates and percentages are used to describe proportions in crime research, including over-representation and under-representation in population demographics. Discover the significance of expressing data in rates and percentages for effective analysis.
Download Presentation

Please find below an Image/Link to download the presentation.
The content on the website is provided AS IS for your information and personal use only. It may not be sold, licensed, or shared on other websites without obtaining consent from the author. Download presentation by click this link. If you encounter any issues during the download, it is possible that the publisher has removed the file from their server.
E N D
Presentation Transcript
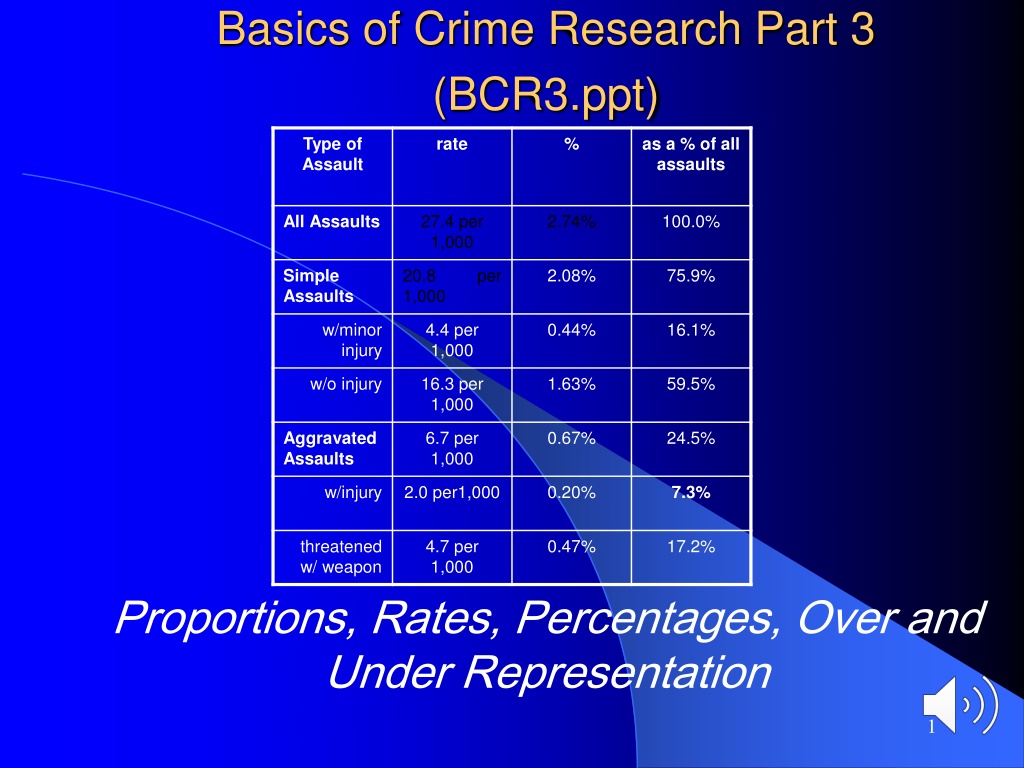
Basics of Crime Research Part 3 (BCR3.ppt) Type of Assault rate % as a % of all assaults 27.4 per 1,000 2.74% 100.0% All Assaults 20.8 1,000 per 2.08% 75.9% Simple Assaults w/minor injury 4.4 per 1,000 0.44% 16.1% w/o injury 16.3 per 1,000 1.63% 59.5% 6.7 per 1,000 0.67% 24.5% Aggravated Assaults w/injury 2.0 per1,000 0.20% 7.3% threatened w/ weapon 4.7 per 1,000 0.47% 17.2% Proportions, Rates, Percentages, Over and Under Representation 1
Proportions Rates and Percentages What Rates and Percentages Describe What proportion of UHWO students are Seniors? What proportion of violent crimes actually cause injury to the victim? What proportion of the prison and jail population is African-American? 2
Percentages Express proportion of group that has a characteristic Percentages are similar to fractions Pretend there are 100 students in this class and 25 of them are seniors 25 = 25 % 100 3
Rates Also express proportion of group that has characteristic Typically used for very large groups nations or states ____ per 100,000 or _____ per 1,000 Especially attractive when percentage is below 1% 4
Examples of Rates If we expressed the 25% of UHWO students as Seniors = 25,000 per 100,000 or 250 per 1,000 Both of these rates say the same thing or have the same information. What percentage of assaults actually end up with injury? 5
NCVS Rates and Percentages Source:http://www.albany.edu/sourcebook/1995/pdf/t312.pdf Type of Assault rate % as a % of all assaults 100.0% It appears that rates are most useful or make the most sense when the percentage drops below 1% 27.4 per 1,000 20.8 1,000 4.4 per 1,000 16.3 per 1,000 6.7 per 1,000 2.0 per1,000 4.7 per 1,000 2.74% All Assaults Simple Assaults w/minor per 2.08% 75.9% 0.44% 16.1% injury w/o injury 1.63% 59.5% 0.67% 24.5% Aggravate d Assaults w/injury 0.20% 7.3% threatened w/ weapon 0.47% 17.2% 6
Over-Representation & Under- Representation Pretend people w/ brown hair = 20% of the general population (I made this up) Everything being equal we would expect 20% of the prison population to have brown hair If more than 20% in prison brown hair is over-represented If less than 20% -- under-represented 7
Over-Representation in Jails and Prisons Incarceration= being locked up in prison or jail Male Inmates in State and Federal Prisons and Local Jails at Mid Year 2000 White Black Hispanic 663,700 791,600 290,900 Per 100K 683 per 100,000 Whites 4,777 per 100,000 Blacks 6.9 x of whites 1,715 per 100,000 Hispanics 2.5x of whites 8 (Source: Prison and Jail Inmates at Mid Year 2000 BJS 2001 )
What Does that Table Mean? Because the rates are proportional, all incarceration rates should be about the same. At mid year 2000, African-American men were incarcerated at a rate that is about 7 times as high as Haoles (4,777/683=6.9), Hispanic men about 2 and a half (1,715/683=2.5); It is a similar story for women 9

 undefined


