Credit Markets and Macroeconomics Overview
Explore the vast landscape of credit markets and macroeconomics, delving into the historical significance, market sizes, key players, and intermediation roles. Gain insights into bank loans, LBOs, secondary loan markets, and the evolution of financial instruments shaping the industry.

Download Presentation

Please find below an Image/Link to download the presentation.
The content on the website is provided AS IS for your information and personal use only. It may not be sold, licensed, or shared on other websites without obtaining consent from the author. If you encounter any issues during the download, it is possible that the publisher has removed the file from their server.
You are allowed to download the files provided on this website for personal or commercial use, subject to the condition that they are used lawfully. All files are the property of their respective owners.
The content on the website is provided AS IS for your information and personal use only. It may not be sold, licensed, or shared on other websites without obtaining consent from the author.
E N D
Presentation Transcript
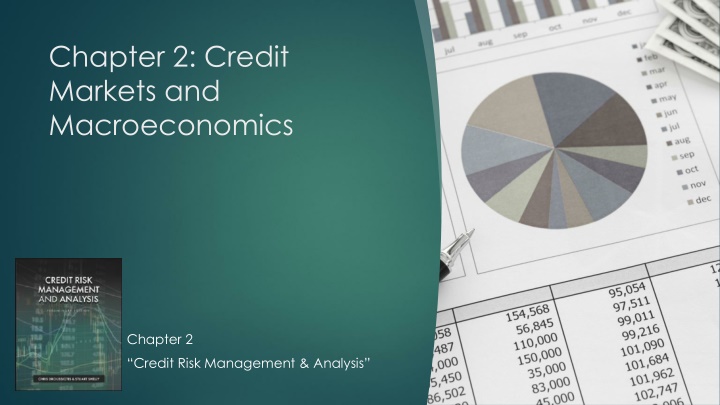
Chapter 2: Credit Markets and Macroeconomics Chapter 2 Credit Risk Management & Analysis
Credit Markets & Macroeconomics Overview Historically credit markets eclipsed equity markets as of August 2024: Residential mortgage ~ $14.1 Trillion, Commercial bank loans ~ $2.8 Trillion, Consumer credit (credit cards and auto finance primarily) ~ $17.4 Trillion. Commercial mortgages ~ $3 Trillion, The US Equities markets have grown enormously in the last decade (as of July 2024): ~ $55 Trillion Apple ($3.3 Trillion), Microsoft ($3.2 Trillion), NVidia($2.9 Trillion), and Amazon and Alphabet (Google parent) each > $1.9 Trillion The US Treasury Market is currently $27.6 Trillion as of August 2024.
Credit Markets & Macroeconomics Overview
Credit Markets Intermediation Role Credit Markets Inter-mediate Capital Capital for borrowers Assets for banks, insurance and pension investors CUSIP (Committee for Uniform Securities identification procedures) 9 digit number Securities (Bonds), evidenced by a Promissory Note a promise to pay, Indenture (like loan agreement), all terms and conditions Enables insurance companies and other investors to buy Notes (less than 10 years) or Bonds (> 10 years) Loans Bank and non-bank advance of credit / capital Loan Agreement & Security Agreement Leases not a Loan Factoring, Merchant Cash Advance Securitization CUSIP, bundling process, trust formation, enables credit assets to become securities
Bank Loans Bank Market defined by two main categories, based on size of borrowers: Middle Market Loans Broadly Syndicated Loans Wholesale Loans Middle Market Loans (defined by each bank) Secured term loans primarily in the form of mortgages and equipment loans Working capital loans borrowing base formula ABL structure
History of LBOs and Secondary Loan Market 1980s Large LBOs need for large bank syndications (multiple lenders party to credit agreements): Previously only in country credits, very little secondary market sales and trading activity Club, Syndicate, Participants Secondary KKR, Bain, Morgan Stanley, Merril, TH Lee, Carlyle, Bass Bros, TPG, Apollo, Blackstone Drexel Junk Bonds Mike Milken RJR Nabisco ($31.1B) BofA alone was asked to commit $1B in Equity and $5B in Debt 1996 CLOs, LMFs & BDCs Loan Mutual Funds, or Prime Rate Funds, Non-bank lenders, securitizations of bank loans BMo / Goldman $800mm, over subscribed in < 30 days to $1.2B in 1996 First BDC Allied Capital (closed) permanent capital, trade at below NAV (like REITS) 2000s - Mature Secondary Trading Two Markets Investment Grade Non- Investment grade
Secondary Loan Market Asset Class Eligible investment for restricted investors (insurance and pensions): CUSIPs Strips maturities, collateral pools, etc Insulation from Interest rate Risk Floating rate loans (Libor now SOFR Secured Overnight Financing Rate) Credit Spread adjustment risk remains Low price volatility Low covariance with other investment asset classes Defensive Strategy High Risk-Adjusted returns relative to other asset classes Liquidity and Ratings CLOs and individual loans often rated, enhancing liquidity and expanding investor eligibility
Secondary Loan Pricing Loan Syndication and Trading Association (LSTA): Improve liquidity and transparency in secondary loan market Syndicate establishes Flex pricing range: Establishes standard pricing formula: Annual Loan Yield = SOFR + spread + (100-OID/Loan term)/100 Example: SOFR = 2.50%, Credit Spread = 4.50%, OID = 99 (99% of par, representing a 1% fee to bank syndicate), Term = 4 years Annual Loan Yield = .025 + .045 + ((100-99)/4)/100 = .07 + .0025 = .0725 Floating rate loans may also be swapped into a fixed rate at an additional swap spread (.05% - .15%) LTSA and Standard & Poors (S&P) Leveraged Commentary & Data (LCD) issue a LevFin benchmark of 100 largest currently traded leveraged finance loans.
SECONDARY LOAN MARKET (Current and OID Yields SOFR (90-Day)= 2.25% Remaining Avg Life Years 3.50 3.75 4.00 2.50 2.25 3.50 2.00 1.75 2.00 3.25 3.50 Secondary Bid Price % 97.500% 99.500% 99.750% 100.500% 97.500% 97.500% 97.500% 97.500% 97.500% 97.500% 97.500% Secondary Ask Price % 97.625% 99.525% 99.850% 101.100% 98.000% 97.750% 98.000% 97.750% 97.875% 98.000% 97.750% Corporate Rating Spread bps OID % Difference to OID Current Yield % OID Yield % Secondary Loan Pricing Companies Facility Axell Corporation Buzz Tech. Corp. Cite Inc. Delmon Company Excelent Hotel Corp. Filarmo Inc. Gray Tech Inc. Holifas Saas Co. Intergem Inc. Jasminsen Corp. Kapko Company B+/B1 B/B2 B+/B1 B-/B3 B+/B2 B-/B2 B+/B2 B/B1 B/B2 BB-/Ba3 B+/B1 TL B TL B TL A TL B TL B TL B TL B TL B TL B TL B TL B 400 475 375 525 450 545 425 400 475 325 425 98.500% 99.000% 99.500% 97.000% 98.250% 98.250% 99.250% 98.750% 99.250% 99.750% 99.000% -1.000% 0.500% 0.250% 3.500% -0.750% -0.750% -1.750% -1.250% -1.750% -2.250% -1.500% 6.964% 7.133% 6.063% 7.300% 7.861% 8.414% 7.750% 7.679% 8.250% 6.269% 7.214% 6.625% 7.250% 6.125% 8.250% 7.188% 8.138% 6.688% 6.563% 7.188% 5.563% 6.750% CY% = SOFR % + Spread % + [ (100%-SBP)/RAL ] Axell Corp s CY% = 2.25% + 4.0% + [(100% - 97.5%)/3.5] = 6.964% OIDY% = SOFR % + Spread % + [ (100%-OID)/ 4 yrs ] Buzz Corp s OCY% = 2.25% + 4.75% + [(100% - 99.0%)/4] = 7.250%
Secondary Market Loan Terms Loan Participation and Silent Participation: Signatory v non-signatory to Loan Documents (Loan Docs) Loan Assignment: A lender may assign rights and obligations to an assignee (obligations to fund can be tricky) Most-favored Nation: Protects participants and assignees from new loan issues to borrower at higher rates Participants and assignees will get a step-up Sunset Provisions: Expiration of MFN up to 90 or 180 days from original loan date
Credit Ratings & Risk Management IG = Better than BBB-: Make-whole v Call Premium Prepayment penalty to compensate lender /investor if rates have moved Non-IG will have a 5% call premium 5% prepayment fee in the event of refinancing as the borrower's credit improves, they will want to refi, this compensates the lender Non-Investment-Grade Bonds / High Yield Bonds (CCC to BB+): Market developed in 1980s by Drexel Burnham Lambert Mike Milken at one point prior to its closure controlled over 50% of the high yield market Last Drexel deal was Kaiser Aluminum, Dec 26, 1989 Credit Derivatives: Interest Rate Swaps World Bank Credit Default Swaps (CDs) Exxon Valdez Banks use to manage credit risk on a loan and portfolio basis
Leveraged Lending credit Analysis March 2013 Supervisory Guidance on Leveraged Lending to Board of Governors: Federal Reserve, OCC (Office of the Comptroller of the Currency), FDIC (Federal depository insurance Corporation) Cash Flow analysis forecasts and integration assumptions Cash flow forecasting needs, estimations of debts service and working capital Merger integration costs Stress tests, downsides and various covenant breaches (defaults) Quarterly assessment post closing of plan v actual Third party collateral and enterprise valuations Current market estimates updated on collateral liquidation values Assessment of FX and interest rate risk of borrower
COVID19 & Global Financial Crisis (GFC) COVID19: Federal Government passed two stimulus spending packages (2020 & 2021): $1.9 T - Coronavirus Aid, relief and economic security ActCARES Act $2.3T Consolidated Appropriations Act (CAA) Banks flush with deposits at low cost of borrowings, generated huge profits Global Financial Crisis GFC TARP (Troubled Assets Relief Program) designed to help shore up banks exposed to defaulted loans: BAML, WaMu / Wells Fargo and Morgan Stanley and Goldman Sachs allowed deposits Mortgage defaults CLOs and other securitizations collapsed Dodd-Frank - Dodd-Frank Wall Street Reform and Consumer Protection Act requires mortgage originators to retain 5% of residential mortgage securitizations C&I loans less affected Explosion of CLOs and non-bank C&I lenders using bank leverage of their portfolios Financial Stabiity & Oversight Council (FSOC) C&I and bank systemic risks to commerce
CLOs, BDCs and Non-bank Lenders Collateralized Loan Obligations Securitization of pools of C&I loans, often LBOs 1996 Goldman Sachs and Bank of Montreal, KMV CLO - $800 million oversubscribed in 30 days to $1.2B Trusted conservative bank, trusted risk rating tools, pedigree of Goldman Sachs Recipe replicated by others Business Development Corporations (BDCs) BDC s are a lending equivalent of the REIT (Real Estate Investment Trust) LP Tax Pass through structure Trade at NAV First was Allied capital no longer in business KKR, THL Credit, many others Special Situations Groups (SSGs): Cerberus, Fortress (Drawbridge) Goldamn Sachs, TPG (Sixth Street), Morgan Stanley (Tactical opportunities) Leveraged and unlevered e.g. $300mm Michael Jackson deal Leasing, ABL and other
Structuring the Tranches of CLOs Metanext CLO Fund IV (MCLO) COLLATERALIZED LOAN OBLIGATION (CLO) STRUCTURE * MCLO Summary Income Statement Revenues Interest Exp. Mgmt Fee Total Income ROE % 5.00% 2.50% 0.50% 25.00 $ (11.25) (2.50) 11.25 $ 22.50% mm PORTFOLIO OF INVESTMENTS Investments in Leveraged Loans LEVERAGED LOAN FUND: Capital Raising as follows: mm DEBT TRANCHES: Tranche A Tranche B Tranche C $450 million Tranche D Tranche E Loan A Loan B Loan C Loan D Weighted Average Cost of Debt L+2.5% * LIBOR offsets Loan F Loan E Loan G Loan H Loan I Loan L Loan K Loan M METANEXT CLO INVESTMENT & PORTFOLIO MANAGEMENT COMPANY Loan P Loan N Loan O Loan Q EQUITY TRANCHE $50 million $500 million Loan S Loan R Loan T Loan U Weighted Average Portfolio Revenue L+5.0% Loan Z Loan X Loan V Loan W Portfolio Management Fee 0.5% Loan AB Loan AC Loan AA Loan AD Loan AE Loan AF Loan AG Loan AH Loan AI Loan AJ Loan AL Loan AK Figure 12.2