Correlation in Data Analysis
Twitter: @Owen134866
www.mathsfreeresourcelibrary.com
Prior Knowledge Check
1) The table shows the scores
out of 10 on a maths test and on
a physics test for 7 students.
Show this information on a
scatter graph.
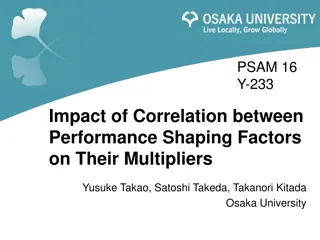
Scatter Graphs
Scatter Graphs are a way of representing 2 sets of
data (bivariate). It is then possible to see whether
they are related.
Positive Correlation
As one variable increases, so does the other
Negative Correlation
As one variable increases, the other decreases
No Correlation
There seems to be no pattern linking the two
variables
Positive
Negative
None
Correlation
4A
Scatter Graphs
In the study of a city, the population density,
in people/hectare, and the distance from the
city centre, in km, was investigated by choosing
sample areas. The results are as follows:
Plot a scatter graph and describe the
correlation. Interpret what the correlation
means.
0
1
4
2
3
10
20
30
50
40
0
Distance from centre (km)
Pop. Density (people/hectare)
The correlation is negative, which means
that as we get further from the city
centre, the population density
decreases.
Correlation
Correlation
Correlation
4A
Scatter graphs are used to
represent data linking 2
variables (bivariate data)
Two variables have a
causal
relationship if a change in one
variable causes a change in the
other
Note that correlation does not
imply causation
Think about context –
sometimes data seems like it is
linked, but actually it is not!
Correlation
Correlation
4A
Scatter graphs are used to
represent data linking 2
variables (bivariate data)
Hideko was interested to see if
there was a relationship between
what people earn and the age at
which they left education or
training. She asked 14 friends to
fill in an anonymous questionnaire
and recorded her results in a
scatter diagram.
a)
Describe the type of
correlation shown
14
16
22
18
20
4
8
12
20
16
0
Age at which
education/training ended
Hourly pay (£)
Weak negative correlation
Correlation
Correlation
4A
Scatter graphs are used to
represent data linking 2
variables (bivariate data)
Hideko says that her data
supports the conclusion that more
education causes people to earn a
lower hourly rate of pay
b) Give one reason why Hideko’s
conclusion might not be valid
14
16
22
18
20
4
8
12
20
16
0
Age at which
education/training ended
Hourly pay (£)
Her data set is very small (and
biased as it is her friends only)
You could also say that people
who left education earlier have
had chance to get work
experience, increasing their pay
Correlation
4B
d
1
x
y
d
2
d
5
d
4
d
3
So the line above will ensure that the sum of
the distances squared is the smallest possible
Correlation
4B
0
5
10
15
20
25
0
10
20
30
40
50
60
Daily mean windspeed (knots)
Daily maximum gust (knots)
There is a strong positive correlation
between daily mean windspeed and daily
maximum gust
Correlation
4B
0
5
10
15
20
25
0
10
20
30
40
50
60
Daily mean windspeed (knots)
Daily maximum gust (knots)
Correlation
4B
0
5
10
15
20
25
0
10
20
30
40
50
60
Daily mean windspeed (knots)
Daily maximum gust (knots)
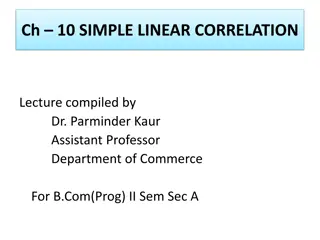
It is possible to use regression techniques to
find equations to match data which follows
different patterns, such as quadratic or
exponential!
Correlation
Linear regression can be used to
calculate the equation of the line
of best fit of a set of data
If you know a value of the
independent variable from a
bivariate data set, it is possible to
use the regression line to make a
prediction of the corresponding
value of the dependent variable…
You should only make predictions
which lie within the data range that
you already have
4B
Correlation
4B
Gestation period (weeks)
32
34
36
38
40
42
30
28
30
32
34
36
38
Head circumference (cm)
Correlation
4B
Gestation period (weeks)
32
34
36
38
40
42
30
28
30
32
34
36
38
Head circumference (cm)
The prediction for 39 weeks falls
within
the range of data we have, so is
more likely
to be accurate
The prediction for 30 weeks falls
outside
of the range of data we have, so
is
less likely
to be accurate
INTERPOLATION
EXTRAPOLATION
Correlation
4B
Gestation period (weeks)
32
34
36
38
40
42
30
28
30
32
34
36
38
Head circumference (cm)
The head circumference is the
dependent
variable
Estimation should always be using the
independent
variable to estimate the
dependent
variable, not the
other way around…
This content discusses how scatter graphs represent data relationships, interpreting correlations, and distinguishing causation from correlation. Learn about positive, negative, and no correlation through practical examples like city population studies and salary-age comparison. Dive into the basics of correlation analysis and apply concepts to real-world scenarios.

Download Presentation

Please find below an Image/Link to download the presentation.
The content on the website is provided AS IS for your information and personal use only. It may not be sold, licensed, or shared on other websites without obtaining consent from the author.If you encounter any issues during the download, it is possible that the publisher has removed the file from their server.
You are allowed to download the files provided on this website for personal or commercial use, subject to the condition that they are used lawfully. All files are the property of their respective owners.
The content on the website is provided AS IS for your information and personal use only. It may not be sold, licensed, or shared on other websites without obtaining consent from the author.
E N D
Presentation Transcript
Statistics Statistics Correlation Correlation Twitter: @Owen134866 www.mathsfreeresourcelibrary.com
Prior Knowledge Check 2) A straight line has equation ? = 0.34 0.21?. 1) The table shows the scores out of 10 on a maths test and on a physics test for 7 students. Write down the gradient and y- intercept of the line. Maths Physics 6 9 7 7 7 6 8 7 9 5 9 4 10 5 ???????? = 0.21 Show this information on a scatter graph. ? ????????? = 0.34
Teachings for Teachings for Exercise 4A Exercise 4A
Correlation Scatter Graphs Scatter Graphs are a way of representing 2 sets of data (bivariate). It is then possible to see whether they are related. Positive Correlation As one variable increases, so does the other Positive Negative Correlation As one variable increases, the other decreases Negative None No Correlation There seems to be no pattern linking the two variables 4A
Correlation Scatter Graphs In the study of a city, the population density, in people/hectare, and the distance from the city centre, in km, was investigated by choosing sample areas. The results are as follows: Pop. Density (people/hectare) 50 40 30 Area Distance 0.6 Pop. Density A B C D E 3.8 2.4 3.0 2.0 20 50 22 14 20 33 10 Area Distance Pop. Density F G 1.8 H 3.4 I J 0 1.5 4.0 0.9 0 1 Distance from centre (km) 2 3 4 47 25 8 16 38 The correlation is negative, which means that as we get further from the city centre, the population density decreases. Plot a scatter graph and describe the correlation. Interpret what the correlation means.
Correlation Correlation Scatter graphs are used to represent data linking 2 variables (bivariate data) Two variables have a causal relationship if a change in one variable causes a change in the other Note that correlation does not imply causation Think about context sometimes data seems like it is linked, but actually it is not! 4A
Correlation Correlation Scatter graphs are used to represent data linking 2 variables (bivariate data) 20 16 Hourly pay ( ) Hideko was interested to see if there was a relationship between what people earn and the age at which they left education or training. She asked 14 friends to fill in an anonymous questionnaire and recorded her results in a scatter diagram. 12 8 4 0 a) Describe the type of correlation shown 22 14 16 18 20 Age at which education/training ended Weak negative correlation 4A
Correlation Correlation Scatter graphs are used to represent data linking 2 variables (bivariate data) 20 16 Hourly pay ( ) Hideko says that her data supports the conclusion that more education causes people to earn a lower hourly rate of pay 12 8 b) Give one reason why Hideko s conclusion might not be valid 4 Her data set is very small (and biased as it is her friends only) 0 22 14 16 18 20 Age at which education/training ended You could also say that people who left education earlier have had chance to get work experience, increasing their pay 4A
Teachings for Teachings for Exercise 4B Exercise 4B
Correlation y Linear regression can be used to calculate the equation of the line of best fit of a set of data d5 d3 d4 d1 d2 One type of line of best fit which is useful is called a least squares regression line . x This is the straight line which minimizes the sum of the squares of the distances of each point from the line So the line above will ensure that the sum of the distances squared is the smallest possible The line will take the form ? = ? + ?? (essentially the same as ? = ?? + ?) At this stage you will not need to calculate the values of ? and ?. The emphasis is on being able to interpret the line in context. 4B
Correlation Daily maximum gust (knots) w ? Linear regression can be used to calculate the equation of the line of best fit of a set of data 60 14 33 13 37 50 13 29 9 23 From the large data set, the daily mean windspeed, ? knots, and the daily maximum gust, ? knots, were recorded for the first 15 days in May in Camborne in 2015. 18 43 40 18 38 7 17 30 15 30 10 28 14 29 20 11 29 The data was plotted on a scatter diagram: 9 23 10 8 21 10 28 7 20 0 a) Describe the correlation between daily mean windspeed and daily maximum gust There is a strong positive correlation between daily mean windspeed and daily maximum gust 0 5 10 Daily mean windspeed (knots) 15 20 25 4B
Correlation Daily maximum gust (knots) w ? Linear regression can be used to calculate the equation of the line of best fit of a set of data 60 14 33 13 37 50 13 29 9 23 From the large data set, the daily mean windspeed, ? knots, and the daily maximum gust, ? knots, were recorded for the first 15 days in May in Camborne in 2015. 18 43 40 18 38 7 17 30 15 30 10 28 14 29 20 11 29 The equation of the regression line of ? on ? for this data is: 9 23 10 8 21 10 28 ? = 7.23 + 1.82? 7 20 0 0 5 10 Daily mean windspeed (knots) 15 20 25 b) Give an interpretation of the value of the gradient of this regression line Remember that gradient represents the change in ? per change in ? In context, as the daily mean windspeed increases by 1 knot, the daily maximum gust increases by 1.82 knots 4B
Correlation Daily maximum gust (knots) w ? Linear regression can be used to calculate the equation of the line of best fit of a set of data 60 14 33 13 37 50 13 29 9 23 From the large data set, the daily mean windspeed, ? knots, and the daily maximum gust, ? knots, were recorded for the first 15 days in May in Camborne in 2015. 18 43 40 18 38 7 17 30 15 30 10 28 14 29 20 11 29 c) Justify the use of a linear regression line in this case. 9 23 10 8 21 10 28 7 20 0 As the graph suggests a linear relationship between ? and ?, it makes sense to use a linear regression line 0 5 10 Daily mean windspeed (knots) 15 20 25 It is possible to use regression techniques to find equations to match data which follows different patterns, such as quadratic or exponential! 4B
Correlation Linear regression can be used to calculate the equation of the line of best fit of a set of data If you know a value of the independent variable from a bivariate data set, it is possible to use the regression line to make a prediction of the corresponding value of the dependent variable You should only make predictions which lie within the data range that you already have 4B
Correlation Head circumference (cm) 38 Linear regression can be used to calculate the equation of the line of best fit of a set of data 36 34 The head circumference, ? cm, and gestation period, ? weeks, for a random sample of newborn babies were recorded, and the scatter graph shows the results. 32 30 Gestation period, ? (weeks) 36 40 33 37 40 39 35 38 Head circumference, y (cm) 30.0 35.0 29.8 32.5 33.2 32.1 30.9 33.6 28 38 40 42 32 30 36 34 Gestation period (weeks) 4B
Correlation Head circumference (cm) 38 Linear regression can be used to calculate the equation of the line of best fit of a set of data 36 ? = ?.?? + ?.???? 34 The equation of the regression line of ? on ? is: 32 ? = 8.91 + 0.624? 30 a) This equation is used to estimate the head circumference of a baby born after 39 weeks and a baby born after 30 weeks. Comment on the reliability of these estimates. 28 38 40 42 32 30 36 34 Gestation period (weeks) The prediction for 39 weeks falls within the range of data we have, so is more likely to be accurate INTERPOLATION The prediction for 30 weeks falls outside of the range of data we have, so is less likely to be accurate EXTRAPOLATION 4B
Correlation Head circumference (cm) 38 Linear regression can be used to calculate the equation of the line of best fit of a set of data 36 ? = ?.?? + ?.???? 34 The equation of the regression line of ? on ? is: 32 ? = 8.91 + 0.624? 30 A nurse wants to estimate the gestation period for a baby born with a head circumference of 31.6cm. 28 38 40 42 32 30 36 34 Gestation period (weeks) b) Explain why the regression equation above is not suitable for this estimate The head circumference is the dependent variable Estimation should always be using the independent variable to estimate the dependent variable, not the other way around 4B