Computing Radiation Fields in Antennas
Explore the computation of radiation fields in antennas, covering topics like energy flux, directivity, effective area, and antenna equivalent circuits. Understand the relationship between electric and magnetic fields and the properties of radiation vectors. Discover the significance of Ampere's law and the behavior of electromagnetic fields in different contexts.

Download Presentation

Please find below an Image/Link to download the presentation.
The content on the website is provided AS IS for your information and personal use only. It may not be sold, licensed, or shared on other websites without obtaining consent from the author. If you encounter any issues during the download, it is possible that the publisher has removed the file from their server.
You are allowed to download the files provided on this website for personal or commercial use, subject to the condition that they are used lawfully. All files are the property of their respective owners.
The content on the website is provided AS IS for your information and personal use only. It may not be sold, licensed, or shared on other websites without obtaining consent from the author.
E N D
Presentation Transcript
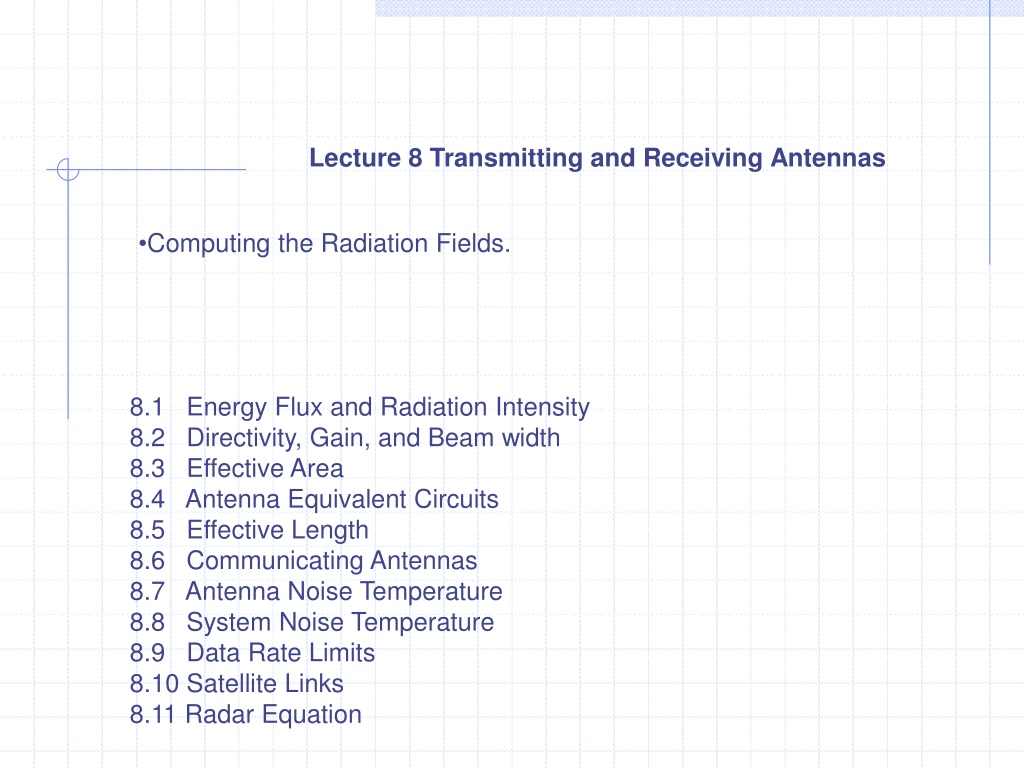
Lecture 8 Transmitting and Receiving Antennas Computing the Radiation Fields. 8.1 Energy Flux and Radiation Intensity 8.2 Directivity, Gain, and Beam width 8.3 Effective Area 8.4 Antenna Equivalent Circuits 8.5 Effective Length 8.6 Communicating Antennas 8.7 Antenna Noise Temperature 8.8 System Noise Temperature 8.9 Data Rate Limits 8.10 Satellite Links 8.11 Radar Equation
Computing the Radiation Fields In the case of harmonic time dependence the representation (7.8) of E and H fields in terms of potentials A , takes the form: ? = ?? ??? ? =1 ?? ? (8.1) and the Lorentz condition (7.10 ) can be rewritten as c (8.2) j + = A 0 2 With the help of the Lorenz condition the E-field can be expressed completely in terms of the vector potential. Solving (8.2) for the scalar potential, = A/j , and substituting in (8.1), we find 1 1 ????? ? ? + ?2? ? = ????? ? ? ??? = where we used 2 = 2/c2 = k2. Thus, the E,H fields are obtained from: 1 ????? ? ? + ?2? 1 ?? ? ? = (8.3) ? = An alternative way of expressing the electric field is: 2
(8.4) 1 ? = ????? ? ? ?? This is Ampere's law solved for E. When applied to a source-free region of space, such as in the radiation zone, (8.4) simplifies into: 1 ? = ????? ? ? (8.5) In computing the curl of A, we may ignore any terms that fall off faster than 1/r: ?? ??? 4??? = ? ?? ??? 4??? ? ??+ ??????? ??????????? ? ? = ? ?? ??? 4?? 1 ?2= ?? ? + ? 1 ?2 = ?? ? ? + ? The angular derivatives arise from the , derivatives in the gradient as per Eq. (7.52). These derivatives act on F( , ), but because they already have a 1/r factor in them and the rest of A has another 1/r factor, these terms will go down like 1/r2. Similarly, when we compute the derivative r[e jkr/r] we may keep only the derivative of the numerator because the rest goes down like 1/r2. 3
Thus, we arrive at the useful rule that to order 1/r, the gradient operator , whenever it acts on a function of the form f( , )e jkr/r, can be replaced by: (8.6) Applying the rule again, we have: (8.7). Noting that ?? = ??? = ? ? ? = ?? and using Eq. (8.5), we finally find: jkr e ( ) = r r E F jkZ 4 r (radiation fields) (8.8) jkr e = r H F jk 4 r Moreover, we recognize that: E 1 (8.9) = = = E H r , H r E Z and Z H Z 4
We note the similarity to uniform plane waves and emphasize the following properties: 1. ?,?, ? form a right-handed vector system. 2. E is always parallel to the transverse part F of the radiation vector F. 3. H is always perpendicular to the radiation vector F. 4. dc current sources ( = k = 0) will not radiate. Fig. 8.1 Electric and magnetic fields radiated by a current source. Figure 8.1 illustrates some of these remarks. The radiation vector may be decomposed in general into a radial part ??= ??? and a transverse part F . In fact, this decomposition is obtained from the identity: ? = ? ? ? + ? ? ? = ???+ ? 5
Resolving F along the spherical coordinate unit vectors, we have: Thus, only F and F contribute to the fields: jkr e 4 (8.10) = + E jkZ F F jkr r (radiation field) e = H jk F F 4 r Recognizing that ? ? = ? ? , we can also write compactly: e jkZ jkr = E F 4 r (radiation field) (8.11) jkr e = H r F jk 4 r 6
In general, the radiation vector will have both F and Fcomponents, depending on the nature of the current distribution J. However, in practice there are three important cases that stand out: 1. Only F is present. This includes all linear antennas and arrays. The z-axis is oriented in the direction of the antenna, so that the radiation vector only has r and components. 2. Only F is present. This includes loop antennas with the xy-plane chosen as the plane of the loop. 3. Both F and F are present, but they are carefully chosen to have the phase relationship F = jF , so that the resulting electric field will be circularly polarized. This includes helical antennas used in space communications. 7
Energy Flux and Radiation Intensity The flux of electromagnetic energy radiated from a current source at far distances is given by the time-averaged Poynting vector, calculated in terms of the radiation fields (8.10): ( 4 2 2 r ( ) ( ) ) jkr jkr 1 1 e e = = + * * * E H F F F F Re Re ikZ ik P P 4 r Noting that ? = ? , we have: jkr e 4 = + E ?? jkZ ??? = ? F F 2 ???+ ??? ??? 2+ ?? 2 = ? ? ?,? jkr r e Therefore, the energy flux vector will be: = H jk F F 4 r 2 Zk ( ) 2 = = r , Pr F P P (8.12) 2 2 32 r Thus, the radiated energy flows radially away from the current source and attenuates with the square of the distance. The angular distribution of the radiated energy is described by the radiation pattern factor: (8.13) With reference to Fig. 7.11, the power dP intercepting the area element dS = r2d defines the power per unit area, or the power density of the radiation: 8
2 dP dP Zk ( ) (8.14) 2 = = = , (power density) P F r 2 2 2 32 dS r d r The radiation intensity U( , ) is defined to be the power radiated per unit solid angle, that is, the quantity dP/d = r2dP/dS = r2Pr: Zk P r d 2 dP ( ) ( ) (8.15) 2 = = = 2 (radiation intensity) , , U F r 2 32 The total radiated power is obtained by integrating Eq. (8.14) over all solid angles d = sin d d , that is, over 0 and 0 2 : ? 2? (8.16) ? ?,? ? (total radiated power) ????= 0 0 A useful concept is that of an isotropic radiator a radiator whose intensity is the same in all directions. In this case, the total radiated power Prad will be equally distributed over all solid angles, that is, over the total solid angle of a sphere sphere= 4 steradians, and therefore, the isotropic radiation intensity will be: ? 2? ?? ? ???? ?? ??? =???? 4? 1 (8.17) ? ?,? ? ??= = = 4? 0 0 ? 9
Thus, UIis the average of the radiation intensity over all solid angles. The corresponding power density of such an isotropic radiator will be: ?? ?? =?? ?2=???? (isotropic power density) (8.18) 4??2 ? 10
Directivity, Gain, and Beamwidth The directive gain of an antenna system towards a given direction ( , ) is the radiation intensity normalized by the corresponding isotropic intensity, that is, ? ?,? =? ?,? ?? =? ?,? ????4?= 4? ???? ?? ? (8.20) (directive gain) It measures the ability of the antenna to direct its power towards a given direction. The maximum value of the directive gain, Dmax, is called the directivity of the antenna and will be realized towards some particular direction, say ( 0, 0). The radiation intensity will be maximum towards that direction, Umax= U( 0, 0), so that ????=???? ?? (directivity) (8.21) The directivity is often expressed in dB, that is, DdB = 10 log10 Dmax. Reexpressing the radiation intensity in terms of the directive gain, we have: ?? ? = ? ?,? = ? ?,? ??=????? ?,? (8.22) 4? and for the power density in the direction of ( , ): ?? ??= ?? ?2? =????? ?,? (power density (8.23 ) ?24? 11
Comparing with Eq. (8.18), we note that if the amount of power PradD(,) were emitted isotropically, then Eq. (8.23) would be the corresponding isotropic power density. Therefore, we will refer to PradD( , ) as the effective isotropic power, or the effective radiated power (ERP) towards the ( , )-direction. In the direction of maximum gain, the quantity PradDmax will be referred to as the effective isotropic radiated power (EIRP). It defines the maximum power density achieved by the antenna: ?? ?? =????? 4??2, (8.24) ? ??? ?????= ???????? ??? Usually, communicating antennas especially highly directive ones such as dish antennas are oriented to point towards the maximum directive gain of each other. A related concept is that the power gain, is simply the gain of an antenna. It is defined as in Eq. (8.20), but instead of being normalized by the total radiated power, it is normalized to the total power PT accepted by the antenna terminals from a connected transmitter, as shown in Fig. 8.2.: (8.25) 12
We will see that the power PT delivered to the antenna terminals is at most half the power produced by the generator the other half being dissipated as heat in the generator s internal resistance. Moreover, the power PT may differ from the power radiated, Prad, because of several loss mechanisms, such as ohmic losses of the currents flowing on the antenna wires or losses in the dielectric surrounding the antenna. Fig. 8.2. Power delivered to an antenna versus power radiated. The definition of power gain does not include any reflection losses arising from improper matching of the transmission line to the antenna input impedance. The efficiency factor of the antenna is defined by: (8.26) 13
In general, 0 e 1. For a lossless antenna the efficiency factor will be unity and Prad = PT. In such an ideal case, there is no distinction between directive and power gain. Using Eq. (8.26) in (8.20), we find G = 4 U/PT= e4 U/Prad, or, (8.27) The maximum gain is related to the directivity by Gmax = eDmax. It follows that the effective radiated power can be written as PradD( , )= PTG( , ), and the EIRP, PEIRP = PradDmax = PTGmax. The angular distribution functions we defined thus far, that is, G( , ), D( , ), U( , ) are all proportional to each other. Each brings out a different aspect of the radiating system. In describing the angular distribution of radiation, it proves convenient to consider it relative to its maximal value. Thus, we define the normalized power pattern, or normalized gain by: (8.28) Because of the proportionality of the various angular functions, we have: (8.29) Writing PTG( , )= PTGmaxg( , ), we have for the power density: 14
(8.30) This form is useful for describing communicating antennas and radar. The normalized gain is usually displayed in a polar plot with polar coordinates ( , ) such that = g( ), as shown in Fig. 8.3. (This figure depicts the gain of a half- wave dipole antenna given by g( )= cos2(0.5 cos )/ sin2 .) The 3-dB, or half- power, beamwidth is defined as the difference B = 2 1of the 3-dB angles at which the normalized gain is equal to 1/2, or, 3 dB. Fig. 8.3. Polar and regular plots of normalized gain versus angle Example 8.1 A TV station is transmitting 10 kW of power with a gain of 15 dB towards a particular direction. Determine the peak and rms value of the electric field E at a distance of 5 km from the station. 15
Solution: The gain in absolute units will be G = 10GdB/10 = 1015/10 = 31.62. It follows that the radiated EIRP will be PEIRP = PTG = 10 31.62 = 316.2 kW. The electric field at distance r = 5 km is obtained from Eq. (8.24): ?? ??=????? 2??2 ? =1 1 ?????? 2 4??2= ? This gives E = 0.87 V/m. The rms value is Erms= E/ 2 = 0.62 V/m. Another useful concept is the beam solid angle of an antenna. The definition is motivated by the case of a highly directive antenna, which concentrates all of its radiated power Pradinto a small solid angle , as illustrated in Fig. 8.4. Fig. 8.4. Beam solid angle and beamwidth of a highly directive antenna 16
The radiation intensity in the direction of the solid angle will be: (8.31) where P = Prad by assumption. It follows that: Dmax = 4 U/Prad = 4 / , or, (8.32) Thus, the more concentrated the beam, the higher the directivity. Although (8.32) was derived under the assumption of a highly directive antenna, it may be used as the definition of the beam solid angle for any antenna, that is, (8.33) Using Dmax = Umax/UI and Eq. (8.17), we have (8.34) 17
where g(,) is the normalized gain of Eq. (8.29). Writing Prad = 4UI, we have: (8.35) This is the general case of Eq. (8.31). We can also write: (8.36) This is convenient for the numerical evaluation of Prad. To get a measure of the beamwidth of a highly directive antenna, we assume that the directive gain is equal to its maximum uniformly over the entire solid angle in Fig. 8.4, that is, D( , )=Dmax, for 0 B/2. This implies that the normalized gain will be: Then, it follows from the definition (8.34) that: (8.37) Using the approximation cos x 1 x2/2, we obtain for small beamwidths: (8.38) 18
and therefore the directivity can be expressed in terms of the beamwidth (8.39) Example 8.2: A satellite in a geosynchronous orbit of 36,000 km is required to have complete earth coverage. What is its antenna gain in dB and its beamwidth? Repeat if the satellite is required to have coverage of an area equal the size of continental US. 19
Solution: The radius of the earth is R = 6400 km. Looking down from the satellite the earth appears as a flat disk of area S = R2. It follows that the subtended solid angle and the corresponding directivity/gain will be: With r = 36,000 km and R = 6400 km, we find D = 126.56 and in dB, DdB = 10 log10 D = 21.02 dB. The corresponding beamwidth will be B= 16/D = 0.36 rad = 20.37o. For the continental US, the coast-to-coast distance of 4800 km, translates to an area of radius R = 2400 km, which leads to D = 900 and DdB = 29.54 dB. The beamwidth is in this case B = 7.64o. Viewing the earth as a flat disk overestimates the required angle Bfor earth coverage. Looking down from a satellite at a height r, the angle between the vertical and the tangent to the earth s surface is given by sin = R/(r + R), which gives for r = 36,000 km, = 8.68o. The subtended angle will be then B = 2 = 0.303 rad = 17.36o. It follows that the required antenna gain should be G = 16/ B2= 174.22 = 22.41 dB. The flat-disk approximation is more accurate for smaller areas on the earth s surface that lie directly under the satellite. 20
Effective Area When an antenna is operating as a receiving antenna, it extracts a certain amount of power from an incident electromagnetic wave. As shown in Fig. 8.5., an incident wave coming from a far distance may be thought of as a uniform plane wave being intercepted by the antenna. Fig. 8.5. Effective area of an antenna. The incident electric field sets up currents on the antenna. Such currents may be represented by a Th evenin-equivalent generator, which delivers power to any connected receiving load impedance. The induced currents also re-radiate an electric field (referred to as the difraction field), which interferes with the incident field causing a shadow region behind the antenna, as shown in Fig. 8.5.. 21
The effective area or effective aperture A of the antenna is defined to be that area, which simply represents how much power is captured from the plane wave and delivered by the antenna. Pincgives the amount of received power PR available at the antenna output terminals: (8.40) For a lossy antenna, the available power at the terminals will be somewhat less than the extracted radiated power Prad, by the efficiency factor PR = ePrad. Thus, we may also define the maximum effective aperture Am as the area which extracts the power Prad from the incident wave, that is, Prad = Am Pinc. It follows that: (8.41) The effective area depends on the direction of arrival ( , ) of the incident wave. For all antennas, it can be shown that the effective area A( , ) is related to the power gain G( , ) and the wavelength = c/f as follows: (8.42) 22
Similarly, because G(,)= eD(,), the maximum effective aperture will be related to the directive gain by: (8.43) In practice, the quoted effective area A of an antenna is the value corresponding to the direction of maximal gain Gmax. We write in this case: (8.44) Similarly, we have for the directivity Dmax= 4 Am/ 2. Because Dmax is related to the beam solid angle by Dmax= 4 / , it follows that (8.45) Writing = c/f, we may express Eq. (8.44) in terms of frequency: ????=4??2? (8.46) ?2 23
The effective area is not equal to the physical area of an antenna. For example, linear antennas do not even have any characteristic physical area. For dish or horn antennas, on the other hand, the effective area is typically a fraction of the physical area (about 55 65 percent for dishes and 60 80 percent for horns.) For example, if the dish has a diameter of d meters, then we have: (8.47) where ea is the aperture efficiency factor, typically ea = 0.55 0.65. Combining Eqs.(8.44) and (8.47), we obtain: (8.48) Antennas fall into two classes: fixed-area antennas, such as dish antennas, for which A is independent of frequency, and fixed-gain antennas, such as linear antennas, for which G is independent of frequency. For fixed-area antennas, the gain increases quadratically with f. For fixed-gain antennas, A decreases quadratically with f. 24
Communicating Antennas The communication between a transmitting and a receiving antenna can be analyzed with the help of the concept of gain and effective area. Consider two antennas oriented towards the maximal gain of each other and separated by a distance r, as shown in Fig. 8.6 . Fig. 8.6 Transmitting and receiving antennas. Let {PT,GT,AT} be the power, gain, and effective area of the transmitting antenna, and {PR,GR,AR} be the same quantities for the receiving antenna. In the direction of the receiving antenna, the transmitting antenna establishes a power density at distance r: 25
(8.49) From the incident power density PT, the receiving antenna extracts power PR given in terms of the effective area ARas follows: (8.50) This is known as the Friisformula for communicating antennas and can be written in several different equivalent forms. Replacing GTin terms of the transmitting antenna s effective area AT, that is, GT = 4 AT/ 2, Eq.(8.50) becomes: (8.51) A better way of rewriting Eq. (8.50) is as a product of gain factors. Replacing AR = 2GR/4 , we obtain: (8.52) The effect of the propagation path, which causes PR to attenuate with the square of the distance r, can be quantified by defining the free-space loss and gain by (8.53) 26
Then, Eq. (8.52) can be written as the product of the transmit and receive gains and the propagation loss factor: (8.54) Such a gain model for communicating antennas is illustrated in Fig. 8.6. An additional loss factor, Gother = 1/Lother, may be introduced, if necessary, representing other losses, such as atmospheric absorption and scattering. It is customary to express Eq. (8.54) additively in dB, where (PR)dB= 10 log10 PR, (GT)dB= 10 log10 GT, etc.: (8.55) 27
Antenna Noise Temperature To be able to detect a weak signal, the receiving system must maintain a noise level that is lower than the received signal. Noise is introduced into the receiving system by several sources. In addition to the desired signal, the receiving antenna picks up noisy signals from the sky, from the atmospheric inhomogeneities (clouds, reins) and other natural or man-made noise sources. Ohmic losses in the antenna itself will be another source of noise. Side lobes from the ground 28
These noise signals, coming from different directions, are weighted according to the antenna gain and result into a weighted average noise power at the output terminals of the antenna. The antenna output is sent over a feed line (such as a waveguide or transmission line) to the receiver circuits. The lossy feed line will attenuate the signal further and also introduce its own thermal noise The output of the feed line is then sent into a low-noise-amplifier (LNA), which preamplifies the signal and introduces only a small amount of thermal noise. The low-noise nature of the LNA is a critical property of the receiving system. The output of the LNA is then passed on to the rest of the receiving system, consisting of down converters, IF amplifiers, and so on. These subsystems will also introduce their own gain factors and thermal noise. Such a cascade of receiver components is depicted in Fig. 8.7 The sum total of all the noises introduced by these components must be maintained at acceptably low levels (relative to the amplified desired signal.) 29
Fig. 8.7. Typical receiving antenna system. The average power N (in Watts) of a noise source within a certain bandwidth of B Hz can be quantified by means of an equivalent temperature T defined through: (8.57) where kis Boltzmann s constant k = 1.3803 10 23 W/HzK and T is in degrees Kelvin. The temperature T is not necessarily the physical temperature of the source, it only provides a convenient way to express the noise power. (For a thermal source, T is indeed the physical temperature.) Eq. (8.57) is commonly expressed in dB as: (8.58) where TdB = 10 log10 T, BdB = 10 log10 B, and kdB = 10 log10 k is Boltzmann s constant in dB: kdB = 228.6 dB. 30
Assuming a 30-MHz bandwidth, we give below some examples of noise powers and temperatures and compute the corresponding signal-to-noise ratio S/N, relative to a 1 pW reference signal (S = 1 pW). The last example shows that 2400K corresponds to 1 pW noise. The average noise power Nant at the antenna terminals is characterized by an equivalent antenna noise temperature Tant, such that Nant = kTantB. The temperature Tantrepresents the weighted contributions of all the radiating noise sources picked up by the antenna through its main lobe and side lobes. The value of Tant depends primarily on the orientation and elevation angle of the antenna, and what the antenna is looking at. 31
An earth antenna looking at the sky sees a noise temperature Tant of the order of 30 60 K. Of that, about 10K arises from the mainlobe and sidelobes pointing towards the sky and 20 40K from sidelobes pointing backwards towards the earth. In rainy weather, Tant might increase by 60K or more. The sky noise temperature depends on the elevation angle of the antenna. For example, at an elevations of 5o, 10o, and 30o, the sky temperature is about 20 K, 10 K, and 4K at 4 GHz, and 25 K, 12 K, and 5K at 6 GHz . The noise temperature of the earth viewed from space, such as from a satellite, is about 254 K. This is obtained by equating the sun s energy that is absorbed by the earth to the thermal radiation from the earth. In general, a noise source in some direction ( , ) will be characterized by an effective noise temperature T( , ), known as the brightness temperature, such that the radiated noise power in that direction will be N( , )= kT( , )B. The antenna temperature Tantwill be given by the average over all such sources weighted by the receiving gain of the antenna: (8.59) 32
Here is the beam solid angle of the antenna. It follows from Eq. (8.43) that serves as a normalization factor for this average: (8.60) Eq. (8.59) can also be written in the following equivalent forms, in terms of the directive gain or the effective area of the antenna: As an example of Eq. (8.59), we consider the case of a point source, such as the sun, the moon, a planet, or a radio star. Then, Eq. (8.59) gives: where gpointand point are the antenna gain in the direction of the source and the small solid angle subtended by the source. If the antenna s mainlobe is pointing towards that source then, gpoint = 1. As another example, consider the case of a spatially extended noise source, such as the sky, which is assumed to have a constant temperature Text over its angular width. Then, Eq. (8.59) becomes: 33
The quantity extis the portion of the antennas beam solid angle occupied by the extended source. As a third example, consider the case of an antenna pointing towards the sky and picking up the atmospheric sky noise through its mainlobe and partly through its sidelobes, and also picking up noise from the ground through the rest of its sidelobes. Assuming the sky and ground noise temperatures are uniform over their spatial extents, Eq. (8.59) will give approximately: where skyand ground are the portions of the beam solid angle occupied by the sky and ground: Assuming that the sky and ground beam solid angles account for the total beam solid angle, we have 34
The sky and ground beam efficiency ratios may be defined by: Then, the antenna noise temperature can be written in the form: (8.61) At 4 GHz and elevation angle of 30o, the sky noise temperature is about 4K. Assuming a ground temperature of 290K and that 90% of the beam solid angle of an earth based antenna is pointing towards the sky and 10% towards the ground, we calculate the effective antenna temperature: Tant = eskyTsky + egroundTground = 0.9 4 + 0.1 290 = 32.6 K. If the beam efficiency towards the sky changes to 85%, then esky = 0.85, eground = 0.15 and we find Tant = 46.9 K. The mainlobe and sidelobe beam efficiencies of an antenna represent the proportions of the beam solid angle occupied by the mainlobe and sidelobe of the antenna. The corresponding beam solid angles are defined by: 35
Thus, the beam efficiencies will be: Assuming that the entire mainlobe and a fraction, say , of the sidelobes point towards the sky, and therefore, a fraction (1 ) of the sidelobes will point towards the ground, we may express the sky and ground beam solid angles as follows: or, in terms of the efficiency factors: 36
Satellite Links Consider an earth-satellite-earth system, as shown in Fig. 8.8. We wish to establish the total link budget and signal to system-noise ratio between the two earth antennas communicating via the satellite. Fig. 8.8. Uplink and downlink in satellite communications. In a geosynchronous satellite system, the uplink/downlink frequencies fu, fdare typically 6/4 GHz or 14/11 GHz. The distances ru, rdare of the order of 40000 km. Let u = c/fuand d = c/fd be the uplink/downlink wavelengths. The free-space gain/loss factors will be from Eq. (8.53): 37
(8.62) The satellite has an on-board amplifier with gain G, which could be as high as 100 120 dB. Using Friis formula in its gain form, Eq. (8.54), the link equations for the uplink, the satellite amplification, and the downlink stages can be written as follows: Expressing PRE in terms of PTE, we have: (8.63) or, showing the free-space loss factors explicitly: (8.64) 38
Because there are two receiving antennas, there will be two different system noise temperatures, say TRSand TRE, for the satellite and earth receiving antennas. They incorporate the antenna noise temperatures as well as the receiver components. The corresponding figures of merit will be the quantities GRS/TRS and GRE/TRE. We may define the uplink and downlink SNR sas the signal- to-system-noise ratios for the individual antennas: (8.65) The system noise TRS generated by the receiving satellite antenna will get amplified by G and then transmitted down to the earth antenna, where it will contribute to the system noise temperature. By the time it reaches the earth antenna it will have picked up the gain factors GGTSGfdGRE. Thus, the net system noise temperature measured at the receiving earth antenna will be: (8.66) The SNR of the total link will be therefore, (8.67) 39
Radar Equation Another example of the application of the concepts of gain and effective area and the use of Friisformulas is radar. Fig. 8.9 shows a radar antenna, which illuminates a target at distance r in the direction of its maximal gain. The incident wave on the target will be reflected and a portion of it will be intercepted back at the antenna. Fig. 8.9 Radar antenna and target. The concept of radar cross section provides a measure of the effective area of the target and the re-radiated power. If the radar antenna transmits power PT with gain GT, the power density of the transmitted field at the location of the target will be: (8.69) 41
From the definition of , the power intercepted by the target and re-radiated is: (8.70) By definition of the radar cross section, the power Ptarget will be re-radiated isotropically and establish a power density back at the location of the radar antenna: (8.71) The amount of power received by the radar antenna will be given in terms of its effective area AR as follows: (8.72) This is also known as Friis formula. Using AR = AT and GT= 4 AT/ 2, we may express Eq. (8.72) in the alternative forms: (8.73) 42
Introducing the equivalent target gain corresponding to the radar cross section, that is, G = 4 / 2, we may also write Eq. (8.73) as the product of gains: (8.74) Fig. 8.10 Gain model of radar equation. Fig. 8.10 shows this gain model. There are two free-space paths and two antenna gains, acting as transmit and receive gains. The minimum detectable received power, PR,min, defines the maximum distance rmaxat which the target can be detected: Solving for rmax, we obtain: (8.75) 43
If the target is not in the direction of maximal gain GTof the antenna, but in some other direction, say ( , ), then the maximal gain GT in Eq. (8.73) must be replaced with GTg( , ), where g( , )is the antenna s normalized gain. The received power can be expressed then as: (8.76) In ground-based air search radars trying to detect approaching aircraft flying at a fixed height h, the power received by the radar can be made to be independent of the distance r, within a certain distance range, by choosing the gain g( , ) appropriately. As shown in Fig. 8.11, the height h is related to r by h = r cos Fig. 8.11. Secant antenna gain. 44
If the gain is designed to have the secant-squared shape g(,)= K/cos2, where K is a constant, then the power will become independent of r. Indeed, The secant behavior is not valid over all polar angles , but only over a certain range, such as 0 max, where max corresponds to the maximum range of the radar rmax = h/ cos max. The desired secant shape can be achieved by appropriate feeds of the radar dish antenna, or by an antenna array with properly designed array factor. Radar can be divided into several different categories according to the wavelength of the radar. The different bands are L,S,C,X,K. The names of the radars originate from the days of WWII. L band radars operate on a wavelength of 15-30 cm and a frequency of 1-2 GHz. L band radars are mostly used for clear air turbulence studies. S band radars operate on a wavelength of 8-15 cm and a frequency of 2-4 GHz. Because of the wavelength and frequency, S band radars are not easily attenuated. This makes them useful for near and far range weather observation. The National Weather Service (NWS) uses S band radars on a wavelength of just over 10 cm. The drawback to this band of radar is that it requires a large antenna dish and a large motor to power it. It is not uncommon for a S band dish to exceed 25 feet in size. 45
C band radars operate on a wavelength of 4-8 cm and a frequency of 4-8 GHz. Because of the wavelength and frequency, the dish size does not need to be very large. This makes C band radars affordable for TV stations. The signal is more easily attenuated, so this type of radar is best used for short range weather observation. The frequency allows C band radars to create a smaller beam width using a smaller dish. C band radars also do not require as much power as an S band radar. The NWS transmits at 750,000 watts of power for their S band, where as a private TV station such as in Des Moines only broadcasts at 270,000 watts of power with their C band radar. X band radars operate on a wavelength of 2.5-4 cm and a frequency of 8-12 GHz. Because of the smaller wavelength, the X band radar is more sensitive and can detect smaller particles. These radars are used for studies on cloud development because they can detect the tiny water particles and also used to detect light precipitation such as snow. X band radars also attenuate very easily, so they are used for only very short range weather observation. Also, due to the small size of the radar, it can therefore be portable like the Doppler on Wheels. (DOW) Most major airplanes are equipped with an X band radar to pick up turbulence and other weather phenomenon. This band is also shared with some police speed radars and some space radars. 46
K band radars operate on a wavelength of .75-1.2 cm or 1.7-2.5 cm and a corresponding frequency of 27-40 GHz and 12-18 GHz. This band is split down the middle due to a strong absorption line in water vapor. This band is similar to the X band but is just more sensitive. This band also shares space with police radars. 47


")


, we note that if the amount of")


")


 is the normalized gain of Eq. (8.29).")


= eD(θ,φ), the maximum")


")
 can be written as the product of the")


")

. It follows that:")