Comparison of Random-Digit Dial vs. Web Panel Employment Survey Samples
This study compares samples from random-digit dialing (RDD) and web-based panel surveys in employment data collection. Findings highlight differences in demographics, age distribution, race composition, and regional representation between the two survey methods. The goal is to assess survey accuracy and relevance in relation to ACS benchmarks.
Uploaded on Sep 19, 2024 | 5 Views
Download Presentation

Please find below an Image/Link to download the presentation.
The content on the website is provided AS IS for your information and personal use only. It may not be sold, licensed, or shared on other websites without obtaining consent from the author.If you encounter any issues during the download, it is possible that the publisher has removed the file from their server.
You are allowed to download the files provided on this website for personal or commercial use, subject to the condition that they are used lawfully. All files are the property of their respective owners.
The content on the website is provided AS IS for your information and personal use only. It may not be sold, licensed, or shared on other websites without obtaining consent from the author.
E N D
Presentation Transcript
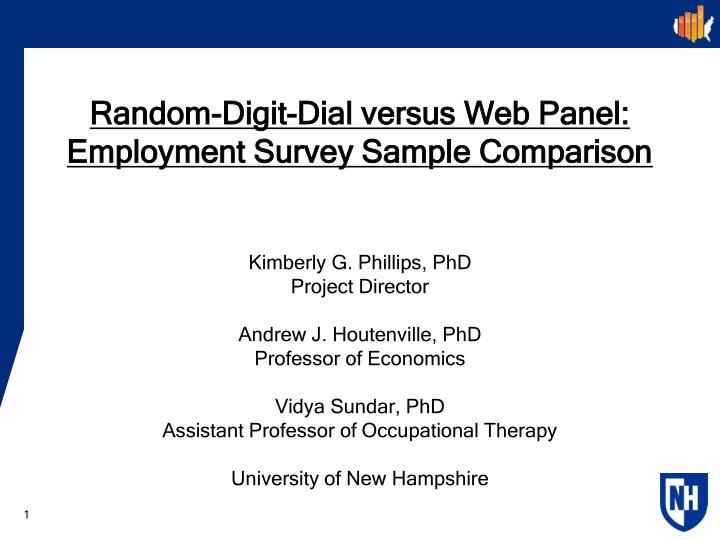
Random Random- -Digit Employment Survey Sample Comparison Employment Survey Sample Comparison Digit- -Dial versus Web Panel: Dial versus Web Panel: Kimberly G. Phillips, PhD Project Director Andrew J. Houtenville, PhD Professor of Economics Vidya Sundar, PhD Assistant Professor of Occupational Therapy University of New Hampshire 1
Acknowledgements Acknowledgements Current work supported by National Institute on Disability, Independent Living & Rehabilitation Research (NIDILRR) grant number 90RT-5037- 01-00 Past work supported by Kessler Foundation Nick Rollins provided American Community Survey (ACS) statistics 2
Background Background Random-digit dialing (RDD) Declining response rates Cell phones Increased expense Development of web-based applications (Web) New mode Ease of responding Paneling (captured samples) 3
Goal Goal Compare samples from RDD & web-based panel survey with reference to ACS benchmarks Data sources RDD: 2015 Kessler Foundation National Employment & Disability Survey Web: Qualtrics, Health Conditions Panel n = 3000 adults 18-64 with at least one disability 4
Findings: Demographics (unweighted %) Findings: Demographics (unweighted %) RDD ACS Web Sex Male Female Age 18-24 25-34 35-44 45-54 55-64 Race White only Black only Other / 2 or more races Region Northeast Midwest South West 45 56 50 50 37 64 9 9 2 12 15 28 37 13 15 26 37 14 16 22 47 79 12 9 72 17 11 89 6 6 17 23 38 21 16 22 41 21 20 25 33 22
Findings: Age (unweighted) Findings: Age (unweighted) 50 40 30 20 10 0 18-24 25-34 RDD 35-44 ACS 45-54 Web 55-64
Findings: Race (unweighted) Findings: Race (unweighted) 100 80 60 40 20 0 White only Black only ACS Other/Multi RDD Web
Findings: Region (unweighted) Findings: Region (unweighted) 50 40 30 20 10 0 Northeast Midwest RDD South West ACS Web
Findings: Demographics (weighted %) Findings: Demographics (weighted %) RDD ACS Web Sex Male Female Age 18-24 25-34 35-44 45-54 55-64 Race White only Black only Other / 2 or more races Region Northeast Midwest South West 49 51 49 51 49 51 9 9 8 13 16 27 37 13 15 26 37 14 15 27 37 74 16 9 72 17 11 74 16 10 16 22 41 21 16 22 41 21 16 23 41 20
Findings: Age (weighted %) Findings: Age (weighted %) 50 40 30 20 10 0 18-24 25-34 RDD 35-44 ACS 45-54 Web 55-64
Findings: Race (weighted %) Findings: Race (weighted %) 80 60 40 20 0 White only Black only ACS Other/Multi Web RDD
Findings: Region (unweighted %) Findings: Region (unweighted %) 50 40 30 20 10 0 Northeast Midwest RDD South West ACS Web
Findings: Disability Type (weighted %) Findings: Disability Type (weighted %) RDD ACS Web Hearing 34 20 31 Vision 31 19 34 Ambulatory 57 50 51 Cognitive 45 42 41
Findings: Disability Type (weighted %) Findings: Disability Type (weighted %) 60 45 30 15 0 Hearing Vision RDD Ambulatory ACS Cognitive Web
Findings: Currently Employed by Disability Type Findings: Currently Employed by Disability Type (weighted %) (weighted %) RDD ACS Web Hearing 43 51 49 Vision 30 40 47 Ambulatory 24 24 29 Cognitive 27 24 34
Findings: Currently Employed by Disability Type Findings: Currently Employed by Disability Type (weighted %) (weighted %) 80 60 40 20 0 Hearing Vision RDD Ambulatory ACS Cognitive Web
Findings: Other Socioeconomic Factors Findings: Other Socioeconomic Factors (weighted %) (weighted %) RDD ACS Web Education Less than high school High school Technical college Some college College grad Beyond college Annual income (HH) Less than $15,000 $15,000-29,999 $30,000-44,999 $45,000-59,999 $60,000-$74,999 $75,000-99,999 $100,000 and up 9 21 35 7 24 9 4 3 27 6 28 22 9 19 7 28 31 12 22 19 12 12 10 9 16 17 17 14 11 9 10 22 14 18 15 13 11 13 16
Findings: Education (weighted %) Findings: Education (weighted %) 40 30 20 10 0 < HS HS grad Some College RDD Assoc College grad Web College plus ACS
Findings: Income (weighted %) Findings: Income (weighted %) 40 30 20 10 0 RDD ACS Web
Summary Summary Overall, both modes approximate ACS, sometimes diverge in different directions Disability Type Disability Type: Both more hearing & vision; Web matches shares for ambulatory & cognitive; RDD higher on all more multiple disabilities Employment Employment: RDD lower employment rates for hearing & vision; Web higher employment for all but hearing, which is like ACS Both, especially Web, higher education education RDD more lowest income income; Both fewer at highest income 20
Why Move Toward Web Why Move Toward Web- -based Samples? based Samples? Cost savings Speed Others (U.S. Census) same direction 21
Comments Comments Despite similarities, neither method is perfect Regardless of mode & sample design, benchmark to ACS With web this can be done before or after survey Ask disability questions in the same way as ACS to facilitate comparisons 22
Contact Information Contact Information Institute on Disability, University of New Hampshire kimberly.phillips@unh.edu andrew.houtenville@unh.edu 23
