Coastal Habitat Mapping in Noumea - May 2016
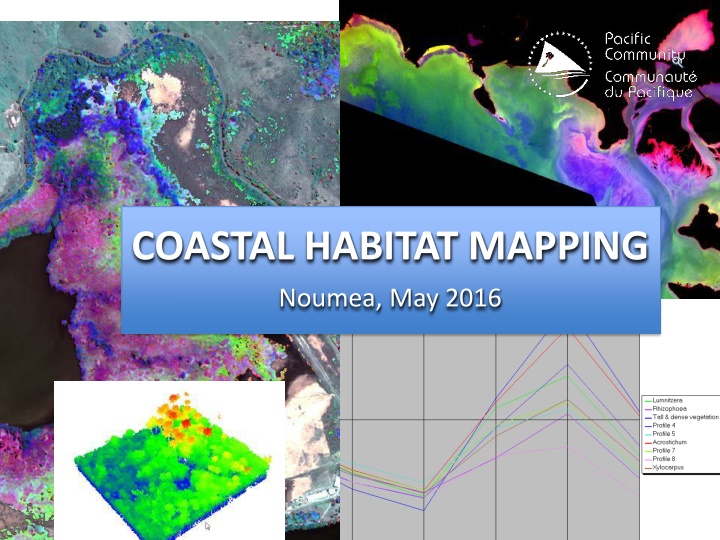
This project utilizes WorldView-2 satellite imagery for coastal habitat mapping in Noumea. The spectral bands and remote sensing techniques are employed to identify shallow water habitats, mangrove areas, and more. Understanding the absorption patterns in water columns helps in the analysis. Various remote sensing processes such as PCA reveal details about water areas, suspended sediments, and bottom types, contributing to light absorption. The focus is on identifying different ecological features like mangroves, urban areas, and grass fields through spectral signatures and imaging analysis.

Uploaded on Mar 09, 2025 | 0 Views
Download Presentation

Please find below an Image/Link to download the presentation.
The content on the website is provided AS IS for your information and personal use only. It may not be sold, licensed, or shared on other websites without obtaining consent from the author.If you encounter any issues during the download, it is possible that the publisher has removed the file from their server.
You are allowed to download the files provided on this website for personal or commercial use, subject to the condition that they are used lawfully. All files are the property of their respective owners.
The content on the website is provided AS IS for your information and personal use only. It may not be sold, licensed, or shared on other websites without obtaining consent from the author.
E N D
Presentation Transcript
COASTAL HABITAT MAPPING Noumea, May 2016
Satellite imagery Satellite Landsat-8 Ikonos QuickBird GeoEye-1 WorldView-1 .6m WorldView-2 2m/.5m WorldView-3 1.2m/.3m Resolution 30m/15m 4m/1m 3m/.7m 1.8m/.5m Bands Pan+8 MS +TIR Pan+4 MS Pan+4 MS Pan+4 MS Pan Pan+8 MS Pan+8 MS +SWIR+CAVIS (defunct) (destroyed) We will use WordView-2 imagery for coastal mapping WorldView-2 satellite
WV2 spectral bands Shallow water habitat Mangrove mapping
Absorption by water column Pan 1 Coastal 2 Blue 3 Green 4 Yellow 5 Red 6 Red Edge 7 NIR1 8 NIR2 Light is strongly absorbed by water especially for red & near infrared wavelengths
Absorption by water column Bands 4,3,2 (visible) Bands 8,7,6 (near infrared) Water areas appear black on infrared bands. Only visible bands are usable for shallow water habitat mapping and the signal decreases quickly with depth
Shallow water remote sensing PCA for water area Dumbea river mouth Raw depth map Suspended sediments, bottom type and depth contribute to light absorption
Shallow water remote sensing PCA for lagoon area excluding areas with lots of suspended sediments By processing the satellite image you can highlight areas with different spectral signatures. If water is clear the color depends on depth and bottom type (you still need to survey the areas to determine the actual bottom type). As depth increases (up to around 20m max), you get less information and the color is mostly influenced by depth.
Mangrove remote sensing Visible bands 4,3,2 NIR-1 band (7) Mangroves areas are wet and appear darker than bare soil, urban areas and grass fields on near-infrared bands.
Mangrove remote sensing PCA excluding water Mangrove map (from NC Atlas) A PCA on all bands excluding water furtherly highlight differences between bare soil (orange), urban areas (magenta), grass fields (light green, khaki) and mangrove areas (sea green, aquamarine)
Mangrove remote sensing Forest Grass fields Mangrove Bare soil Urban area PCA excluding water Classification from PCA Using the non water it is possible to do a first classification and extract areas with similar signatures. This might include vegetation not belonging to the mangrove area.
Mangrove remote sensing Forest Grass fields Mangrove Bare soil Urban area Classification from PCA Reflectances for mangrove classes The classification can be used as a mask to select only pixels with a signature belonging to the mangrove classes
Mangrove remote sensing Pixels for mangrove classes PCA on selected pixels Finally a PCA on the mangrove class pixels highlights the differences
Mangrove remote sensing Field survey is then necessary to determine what species correspond to the PCA
Mangrove remote sensing Bands 6,7,8 (red edge and near-infrared) is where you get the most differences in spectral signatures between mangrove species.
Radiometric calibration of images for change detection Two images of the same location from the same satellite will differ due to sensor calibration, atmospheric conditions, sun distance and sun angle. Radiometric calibration goal is to standardize the images values DN values The original image Apparent radiance Apparent reflectance Atmospheric correction etc Haze removal, topographic effect Ground reflectance
Change detection Once images have been radiometrically calibrated it is possible to apply change detection to highlight areas that have changed (e.g. damaged by a cyclone) Note that in the South Pacific image acquisition is not systematic and change detection will be conditioned by availability of imagery and cloud coverage.
Aerial imagery & LiDAR LiDAR & aerial imagery has been collected in 2012 by AAM contracted by Geoscience Australia for vulnerability assessment of Efate, Malekula and Espiritu Santo
LiDAR for canopy height Raw LiDAR data can be processed to determine canopy height. LiDAR files are huge and can only be processed with specific software. In addition this type of information is only available for one of the project sites (Paunangisu)
Aerial imagery Simultaneously with LiDAR, AAM acquired aerial imagery. The imagery is from 2012 and lacks the NIR bands from satellite images but has a much higher resolution. Again it is only available to Paunangisu area and subject to restrictions on distribution and use.