Clinical Research Prediction Models Overview

Prediction Models and Risk Score Generation in
Clinical Research: An Introduction
OSCTR BERD WORKSHOP
October 29
th
, 2021
Tabitha Garwe, PhD, MPH
Associate Director – OSCTR BERD
Associate Professor of Epidemiology
Director, Surgical Outcomes Research
Co-Director – BERD Clinical Epidemiology Unit
1
Seminar Outline
•
Theoretical Background
–
Model development
–
Model Performance
–
Internal Validation
–
External Validation
•
Applied example using logistic regression
Major Types of Clinical Epidemiologic Studies
3
Clinical
Clinical
Practice :
Challenges
Challenges
DIAGNOSTIC
DIAGNOSTIC
RESEARCH
RESEARCH
PROGNOSTIC
PROGNOSTIC
RESEARCH
RESEARCH
INTERVENTION
INTERVENTION
RESEARCH
RESEARCH
ETIOLOGIC
ETIOLOGIC
RESEARCH
RESEARCH
PREDICTION
PREDICTION
RESEARCH
RESEARCH
CAUSAL
CAUSAL
RESEARCH
RESEARCH
Diagnostic and Prognostic Research
•
Diagnostic Research Objectives
–
Individual test accuracy
–
ID combination(s) of tests that have the largest diagnostic yield
–
Does new test provides additional diagnostic value in clinical practice?
–
Is a less burdensome/inexpensive test an alternative?
•
Prognostic Research Objectives
–
which combination of determinants under study best predicts a future
outcome?
–
additional predictive value beyond other available predictors.
–
may include comparison of the predictive accuracy of two (new) markers.
4
Prediction Models
•
Diagnostic process and prognostication - multivariable in
nature
•
Require studies that follow a multivariable approach in design
and analysis
•
Prediction models designed to assist healthcare professionals
and patients make informed decisions
–
use clinical and non-clinical patient characteristics to estimate the
probability that a certain outcome is present (diagnostic) or will occur
within a defined time period (prognostic)
–
not a substitute for clinical experience
5
Prognostic Score Example
•
APACHE II Calculator
•
http://clincalc.com/IcuMortality/APACHEII.aspx
Smartphone App Example
Gonzalez et al., 2015, J Trauma Acute Care Surg Volume 78, Number 5
Model Objective and Study Design
•
Is a new model needed?
•
Diagnostic Studies
:
Cross-sectional,
consecutive patients
suspected
of having a particular outcome
•
Prognostic studies:
Cohort
(preferably prospective), consecutive
patients
at risk
of the outcome; also
Case-cohort
•
Data Source Identification
- Data should be representative of the
target population for which a model is to be developed
–
Prediction models best developed using prospectively collected data
8
Sample Size Considerations
•
Generally based on “events-per-variable” rule of thumb
–
At least 10 outcome events required per candidate predictor
parameter estimated
•
Traditional sample size calculation for regression analysis
–
I prefer the PASS Sample Size software
•
Refined criteria for determining the sample sizes for model
development have recently been proposed (Riley et al., 2020)
–
‘pmsampsize’ package for Stata and R.
9
Riley RD, Ensor J, Snell KIE, et al. Calculating the sample size required for developing a clinical prediction
model. BMJ. 2020;368:m441. https://doi.org/10.1136/bmj.m441
Outcome
–
Important, easily available, clearly defined and have minimal
measurement error.
–
Typically dichotomous but may comprise continuous variables such as
tumor growth, pain, or quality of life, etc.
–
Generally should not study intermediate outcomes
–
Time period of outcome occurrence important
•
Prediction over a shorter period is commonly less problematic than prediction over
a longer time period.
•
Follow-up time may differ- use Kaplan Meier or Cox regression
–
Blinding important
Predictors
•
Predictors should preferably be measured using methods
applicable-or potentially applicable-to daily practice
•
Feasibility plays an important role in choosing determinants
–
study proxy or surrogate predictors if the underlying predictor is too
cumbersome to measure
•
Potential predictors should be measured and analyzed with a view
to
chronological hierarchy
in practice
Missing Data
•
Complete case analysis can substantially reduce the data
available and may introduce bias
–
Data may not be missing at random
•
One can consider excluding predictors missing in a sizable
proportion of the data
•
Multiple imputation is the preferred approach for handling
missing data
12
Model Fitting and Predictor Selection
•
Multivariable techniques
–
Logistic regression – dichotomous outcome
–
Cox regression – time to event data
–
Linear regression – continuous outcomes
–
Penalized regression (ridge, lasso)
–
Machine learning techniques (tree based, neural networks)
•
Predictor Selection
–
Any information that precedes the outcome of interest in time and potentially
predictive of outcome
•
demographic variables, clinical history, physical examination findings, type and severity of disease,
comorbid conditions, and laboratory or imaging results.
•
Events per variable (EPV) rule of thumb - at least 10 individuals with outcome event per predictor
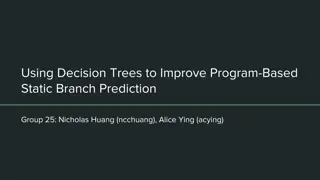
Predictor Selection Strategies
•
Subject matter/ clinically-driven
–
clinical experts in the research group or by literature review
•
Data-driven
–
Univariate analysis (discouraged)
–
multivariable modeling using forward selection (highly discouraged) or backward
elimination
–
Penalized regression (ridge, lasso) – limit overfitting
–
All predictors initially included and selection occurs during the machine-learning
based model development phase (tree-based, random forests, etc.)
•
Reducing number of candidate variables
–
combining similar predictors to a single one
–
exclude predictors that are highly correlated with others
–
Exclude frequently missing or predictors with limited variability among the study
population
14
Model Assumptions and Predictions
•
A model that satisfies its underlying assumptions will yield
better predictions
•
Evaluate predictions in new data
•
Example – simple logistic regression
–
2-week mortality ~ a + b1(ISS) + b2(PEC)
•
Distribution of 2-week mortality is binomial
•
ISS has a linear effect
•
Effects of PEC and ISS can be added
15
Continuous Predictors and Interactions
•
Categorizing continuous variables into intervals
–
adding multiple categories spends more degrees of freedom
–
can lead to overfitting of the model
–
consider non-linear relationships with the outcome (e.g. using
restricted cubic splines or fractional polynomials)
•
Effect of one predictor on the outcome may be dependent on
the value of another predictor
–
Important interactions may be prespecified
apriori
and considered in
model development
16
ACI-TIPI Clinical Decision Rule
Newman & Kohn, EBD, 1
st
Edition
Model Performance
•
Discrimination - how well the test differentiates between
patients more and less likely to have the outcome
•
Calibration - how well the probability estimated from the test
result matches the actual probability
–
Low and high predictions correct?
18
Model Performance Measures: Discrimination
•
Most common multivariable techniques
–
Logistic regression – dichotomous outcome
•
AUROC (c-statistic)
–
Cox regression – time to event data
•
Outcomes of censored patients unknown, constructing ROC impossible
•
Concordance statistic (c-statistic can be easily calculated) – same
interpretation as AUROC
–
Linear regression – continuous outcomes
•
Squared multiple correlation coefficient (R
2
), aka the explained variance
AUROC Curve
•
Also known as a
relative operating
characteristic curve
•
The ROC curve illustrates sensitivity and
specificity tradeoffs as we vary the cutoff
point
–
A plot of the FP probability on the x-axis and
the TP probability on the y-axis across several
thresholds of a continuous value
•
Each point on the curve represents a Se/Sp
pair corresponding to a particular cut-off
(decision threshold or criterion value)
•
AUC is the area between the curve and the
X-axis
20
Area Under the ROC Curve (AUC)
–
Quantifies the discrimination of the test
•
the probability that, confronted with a pair of randomly chosen patients, one of whom truly has
the disease of interest and the other of whom truly does not, the test will accurately identify
which of the pair has the disease.
•
The AUC summarizes the whole of the ROC curve, and therefore all parts of the curve are
represented within the AUC.
http://osctr.ouhsc.edu/Seminar%20Series
Model Performance Measures: Discrimination
Binary Outcomes
•
Overall Misclassification (Error) Rate
–
the proportion of observations (over the sample) for which the
predicted outcome and actual outcome disagree;
Error Rate = (FP +
FN)/N
•
Accuracy Rate
= 1 − misclassification rate
•
False positive and False Negative Rates
•
P^(Y=1|X ) + P^(Y=0|X ) = 1
(where P^(= predicted probability and
X=covariates)
•
SAS default : If P^(Y=1>0.5|X ) then Test = 1 (positive) else test = 0 (negative)
–
FP/FN
compare actual classification to test classification
Model Performance Measures: Discrimination
Tjur R-Squared
•
Also known as Tjur’s D or Tjur’s coefficient of discrimination
•
Mean difference of the predicted probabilities of the two
response levels
–
For each of the two categories of the dependent variable, calculate
the mean of the predicted probabilities of an event. Then, take the
absolute value of the difference between those two means, that’s it!
•
Closely related to R2 definitions for linear models
Allison, P. D. Commentary (2014). Measures of fit for logistic regression.
In Proceedings of the SAS Global Forum 2014 Conference.
Model Performance Measures: Recalibrating or
updating a model
•
Reclassification Measures: Extent to which an extended model
improves the classification of participants with and without the
outcome compared with the basic model without that
predictor.
•
Net Reclassification Improvement (NRI)
–
Quantifies the number of individuals that are correctly reclassified
into clinically meaningful higher or lower risk categories with the
addition of a new predictor, using pre-specified risk groups [Pencina
et al., 2008].
Model Performance Measures: Reclassification
Measures
•
Integrated Discrimination Improvement (IDI)
–
In contrast to the NRI, the IDI does not require subjectively predefined
risk thresholds.
–
Estimated improvement in the average sensitivity of the basic model
with addition of the new predictor minus the estimated decrease in the
mean specificity, summarized over all possible risk thresholds.
•
NRI and IDI – Potentially useful model performance measures
–
Newer, statistical methods not yet well developed
–
Careful application is necessary
Model Performance Measures: Calibration
•
Quantifying/Assessing Calibration
–
Calibration plot - graph of observed versus predicted
probabilities
•
Calibration slope -- < 1 (overfitted); > 1 (underfitted)
–
Goodness of Fit Tests (e.g. Hosmer and Lemeshow)
–
Bland-Altman Calibration Plots with Mean Bias* and SD of Errors
–
Brier Score (Mean Squared Error)
•
Note, overall calibration of a model is generally good in
the “derivation” dataset
–
E.g. mean bias is always 0 for a logistic regression model in the
dataset used to derive its coefficients
Model Performance Measures: Calibration
•
How accurate are the predicted probabilities?
–
Break the population into groups (often deciles of risk)
–
Compare actual (observed frequencies) and predicted probabilities for
each group
–
Goodness-of-Fit statistical tests (e.g. Hosmer-Lemeshow) provide p-
values for the discrepancy between observed and predicted
probabilities but no summary estimate of "effect size“
•
Large sample size - P-values can be statistically significant even when the
calibration is good
•
Small sample size - poor calibration will not be statistically significant
Calibration Plots
28
Grant et al., 2018. Statistical Primer: developing and validating a risk prediction model
Model Performance Measures: Calibration
The Brier Score
•
Mean squared difference between the predicted probability and
the actual outcome.
–
Ranges from 0 (perfect agreement in prediction) to 1 (perfect
disagreement in prediction).
–
If the predicted probability is 1 and the outcome occurs, then the Brier
Score is 0, the best score achievable.
•
predicted probability is 0.8 and it happens, then the Brier Score is (0.8-1)^2
=0.04.
–
The lower the Brier score is for a set of predictions, the better the
predictions are calibrated.
Internal Validation and Shrinkage of the Prediction Model
•
Initial prediction model applied to the data from which it is derived tends to be
overly optimistic
–
Overfitting, regression-to-the-mean bias
–
model’s predicted probabilities will be too extreme (too high for the diseased and too low for the non-
diseased) when the model is applied to new patients; calibration will be poorer and discrimination
lower in daily practice [Altman et al., 2009; Moonset al., 2012b].
•
Amount of overfitting can be estimated and corrected using internal validation
methods
–
Split sample and cross-validation – one sample used for development and remainder for
estimating accuracy
–
Bootstrapping
– first model is developed on full sample, then multiple random samples are
drawn from the full sample - Average optimism in discrimination and calibration can be
used to adjust original model (i.e. shrink the model)
–
Heuristic shrinkage factor; penalized estimation methods
Split-sample Validation
31
-
Inefficient
-
Replication instability
K-fold cross-validation
32
http://qingkaikong.blogspot.com/
Harrell - Bootstrapping Steps
•
1. Develop the model using all
n
subjects and whatever stepwise testing is deemed necessary. Let
C
app
denote the apparent
C
from this model, i.e. computed on the same sample used to derive the
fit.
•
2. Generate a sample of size
n
with replacement from the original sample (for both predictors and
the response).
•
3. Fit the full or possibly stepwise model, using the same stopping rule as was used to derive
C
app
.
•
4. Compute the apparent C for this model on the bootstrap sample with replacement. Call it
C
boot
.
•
5. ‘Freeze’ this reduced model, and evaluate its performance on the original dataset. Let
C
orig
denote the
C
.
•
6. The optimism in the fit from the bootstrap sample is
C
boot
– C
orig
.
•
7. Repeat steps 2 to 6 100-200 times.
•
8. Average the optimism estimates to arrive at
O
.
•
9. The bootstrap corrected performance of the original stepwise model is
C
app
–
O
.
Harrell - Bootstrapping Steps
Internal Validation
•
In general, shrinkage of regression coefficients may improve the
performance of a prognostic model substantially.
•
When the sample size is large, no shrinkage will be required, in contrast to a
small data set, where a substantial shrinkage may be needed ( Steyerberg &
Harrell,2000).
–
If the number of predictors over the number of observations is less than 1/10,
shrinkage is necessary, if this ratio is between 1/10 and 1/20, shrinkage is advisable,
and if the ratio is smaller than 1/20, shrinkage is not necessary.
•
Internal validation techniques only address pure sampling variability and not
changes in patient population
–
Not a substitute for external validation
Penalized Regression
•
Flexible shrinkage approach that is effective when the EPV is low
(<10)
•
Aims to fit the same statistical model as standard regression but
uses a different estimation procedure
•
Few events - the range of the predicted risks is too wide
–
can be reduced by shrinking the regression coefficients towards zero
•
Penalized regression places a constraint on the values of the
regression coefficients
–
Ridge, lasso
36
Penalized Regression
37
Pavlou et al., BMJ 2015;351:h3868
Bias in Prognostic Research
•
Confounding is not an issue in prediction research
•
Loss to follow-up (Prognostic)
–
Bias due to indeterminates, missing data
•
Multiple imputation
•
Worst-case sensitivity analysis
•
Ascertainment (Incorporation) bias[Diagnostic/Prognostic]
–
Diagnostic Review bias
•
Test/predictor that is being evaluated is included in the reference standard
–
Test Review Bias
Biases
•
Biases
–
Verification Bias (Diagnostic)
•
When the decision to perform the reference standard depends on the result of the
index test (partial verification)
•
When the type of reference standard used depends on the result of the index test
(differential verification)
–
Spectrum Bias (Diagnostic/Prognostic)
•
Subjects of dx test study do not have a reasonable spectrum of the condition being
tested for and of the ‘non-disease’ that may mimic it
•
Study population not representative of target population
–
Overfitting Bias (Diagnostic/Prognostic)
•
‘If you torture data sufficiently, it will confess to almost anything’ – Fred Menger
(Newman, EBD)
•
Mainly a problem when a combination of tests is chosen from many candidate tests to
identify a disease or predict a prognosis
39
External Validation
•
Aims to address the accuracy of a model in patients from a
different but plausibly related population, representing the
underlying disease domain.
•
Temporal validation
•
Geographical validation
•
Domain/Setting validation
•
Internal validation alone is limited in determining the
generalizability of a prediction model
External Validation:
Comparisons Between Derivation and Validation Data
•
Study Population and Variables
–
Patient characteristics and overall outcome rates
–
Outcome definition and ascertainment
•
Selection of diseased and non-diseased
otherwise spectrum bias
•
Outcome ascertainment independent of outcome
otherwise diagnostic review bias
–
Predictor ascertainment
•
Independent of outcome
otherwise incorporation bias
•
Model performance
–
Calibration – Hosmer-Lemeshow GOF test; Calibration plot (observed vs predicted);
Calibration slope; Brier Score
–
Discrimination – AUC (C-statistic); also Tjur R-squared, Error Rate
Presenting the Prediction Model
•
Original untransformed model
–
calculator or computerized patient record
•
Nomogram
•
Decision tree - Classification and Regression Trees (CART)
–
creates a rule such as 'If a patient has finding a, b, or c, they have an XX probability of disease Y'
Presenting the Prediction Model
•
Simplified risk score (SRS)
–
Commonly done using the Framingham Methodology (Sullivan et al.,
2004)
•
divide each regression coefficient by the smallest regression coefficient
–
Must be accompanied by the observed disease frequencies across score
categories
–
Some loss in dx accuracy, but minimal and easy to use
–
Grobbee & Hoes recommend reporting both the untransformed model
and SRS with AUROCs
43
Use of Points System vs Multivariable Models
•
For most risk profiles, there is very good agreement (ICC >
0.9)between the estimates (predicted probabilities) produced
by the points system and those produced by the MV models.
–
Divergences occur primarily at the extremes
–
Loss of information is slightly more pronounced when the risk factors
are modelled as continuous
Sullivan et al., 2004
Model Impact
•
Impact of the risk prediction model on clinical practice.
•
Gold-standard design
–
Randomized, controlled clinical trial comparing patient outcome
between randomized groups
45
Randomize
Model Impact
•
Net benefit decision curve analysis
46
Vickers, A. J., van Calster, B., & Steyerberg, E. W. (2019). A simple, step-by-step guide to interpreting decision curve
analysis.
Diagnostic and prognostic research
,
3
, 18.
Grant et al., 2018. Statistical Primer: developing and validating a risk prediction model
Reporting: The TRIPOD Statement
The TRIPOD Statement
Applicability of Prediction Models
•
Prediction models often too complex for daily use in clinical
settings
•
Diagnostic/prognostic models not routinely validated
•
Tests/factors included in the final model – inclusion of
advanced tests may lead to a limited applicability
•
Clinicians may find it difficult to include explicit predicted
probabilities in their decision making
Applied Example
Applied Example: The Trauma Embolic Scoring System
51
Applied Example: External Validation
Rogers et al., J Trauma Acute Care Surg,
Vol 73, Num 2
Acknowledgements
•
David Thompson, PhD, Emeritus Associate Professor of Biostatistics
53
54
Delve into the world of prediction models and risk score generation in clinical research with an introduction to various types of studies, diagnostic and prognostic research, and the development and validation of prediction models. Explore how these models assist healthcare professionals and patients in making informed decisions based on patient characteristics.

Download Presentation

Please find below an Image/Link to download the presentation.
The content on the website is provided AS IS for your information and personal use only. It may not be sold, licensed, or shared on other websites without obtaining consent from the author.If you encounter any issues during the download, it is possible that the publisher has removed the file from their server.
You are allowed to download the files provided on this website for personal or commercial use, subject to the condition that they are used lawfully. All files are the property of their respective owners.
The content on the website is provided AS IS for your information and personal use only. It may not be sold, licensed, or shared on other websites without obtaining consent from the author.
E N D
Presentation Transcript
Prediction Models and Risk Score Generation in Clinical Research: An Introduction OSCTR BERD WORKSHOP October 29th, 2021 Tabitha Garwe, PhD, MPH Associate Director OSCTR BERD Associate Professor of Epidemiology Director, Surgical Outcomes Research Co-Director BERD Clinical Epidemiology Unit 1
Seminar Outline Theoretical Background Model development Model Performance Internal Validation External Validation Applied example using logistic regression
Major Types of Clinical Epidemiologic Studies Clinical Practice : Challenges PREDICTION RESEARCH CAUSAL RESEARCH DIAGNOSTIC RESEARCH PROGNOSTIC RESEARCH INTERVENTION RESEARCH ETIOLOGIC RESEARCH 3
Diagnostic and Prognostic Research Diagnostic Research Objectives Individual test accuracy ID combination(s) of tests that have the largest diagnostic yield Does new test provides additional diagnostic value in clinical practice? Is a less burdensome/inexpensive test an alternative? Prognostic Research Objectives which combination of determinants under study best predicts a future outcome? additional predictive value beyond other available predictors. may include comparison of the predictive accuracy of two (new) markers. 4
Prediction Models Diagnostic process and prognostication - multivariable in nature Require studies that follow a multivariable approach in design and analysis Prediction models designed to assist healthcare professionals and patients make informed decisions use clinical and non-clinical patient characteristics to estimate the probability that a certain outcome is present (diagnostic) or will occur within a defined time period (prognostic) not a substitute for clinical experience 5
Prognostic Score Example APACHE II Calculator http://clincalc.com/IcuMortality/APACHEII.aspx
Smartphone App Example Gonzalez et al., 2015, J Trauma Acute Care Surg Volume 78, Number 5
Model Objective and Study Design Is a new model needed? Diagnostic Studies: Cross-sectional, consecutive patients suspected of having a particular outcome Prognostic studies: Cohort (preferably prospective), consecutive patients at risk of the outcome; also Case-cohort Data Source Identification - Data should be representative of the target population for which a model is to be developed Prediction models best developed using prospectively collected data 8
Sample Size Considerations Generally based on events-per-variable rule of thumb At least 10 outcome events required per candidate predictor parameter estimated Traditional sample size calculation for regression analysis I prefer the PASS Sample Size software Refined criteria for determining the sample sizes for model development have recently been proposed (Riley et al., 2020) pmsampsize package for Stata and R. Riley RD, Ensor J, Snell KIE, et al. Calculating the sample size required for developing a clinical prediction model. BMJ. 2020;368:m441. https://doi.org/10.1136/bmj.m441 9
Outcome Important, easily available, clearly defined and have minimal measurement error. Typically dichotomous but may comprise continuous variables such as tumor growth, pain, or quality of life, etc. Generally should not study intermediate outcomes Time period of outcome occurrence important Prediction over a shorter period is commonly less problematic than prediction over a longer time period. Follow-up time may differ- use Kaplan Meier or Cox regression Blinding important
Predictors Predictors should preferably be measured using methods applicable-or potentially applicable-to daily practice Feasibility plays an important role in choosing determinants study proxy or surrogate predictors if the underlying predictor is too cumbersome to measure Potential predictors should be measured and analyzed with a view to chronological hierarchy in practice
Missing Data Complete case analysis can substantially reduce the data available and may introduce bias Data may not be missing at random One can consider excluding predictors missing in a sizable proportion of the data Multiple imputation is the preferred approach for handling missing data 12
Model Fitting and Predictor Selection Multivariable techniques Logistic regression dichotomous outcome Cox regression time to event data Linear regression continuous outcomes Penalized regression (ridge, lasso) Machine learning techniques (tree based, neural networks) Predictor Selection Any information that precedes the outcome of interest in time and potentially predictive of outcome demographic variables, clinical history, physical examination findings, type and severity of disease, comorbid conditions, and laboratory or imaging results. Events per variable (EPV) rule of thumb - at least 10 individuals with outcome event per predictor
Predictor Selection Strategies Subject matter/ clinically-driven clinical experts in the research group or by literature review Data-driven Univariate analysis (discouraged) multivariable modeling using forward selection (highly discouraged) or backward elimination Penalized regression (ridge, lasso) limit overfitting All predictors initially included and selection occurs during the machine-learning based model development phase (tree-based, random forests, etc.) Reducing number of candidate variables combining similar predictors to a single one exclude predictors that are highly correlated with others Exclude frequently missing or predictors with limited variability among the study population 14
Model Assumptions and Predictions A model that satisfies its underlying assumptions will yield better predictions Evaluate predictions in new data Example simple logistic regression 2-week mortality ~ a + b1(ISS) + b2(PEC) Distribution of 2-week mortality is binomial ISS has a linear effect Effects of PEC and ISS can be added 15
Continuous Predictors and Interactions Categorizing continuous variables into intervals adding multiple categories spends more degrees of freedom can lead to overfitting of the model consider non-linear relationships with the outcome (e.g. using restricted cubic splines or fractional polynomials) Effect of one predictor on the outcome may be dependent on the value of another predictor Important interactions may be prespecified apriori and considered in model development 16
ACI-TIPI Clinical Decision Rule Newman & Kohn, EBD, 1st Edition
Model Performance Discrimination - how well the test differentiates between patients more and less likely to have the outcome Calibration - how well the probability estimated from the test result matches the actual probability Low and high predictions correct? 18
Model Performance Measures: Discrimination Most common multivariable techniques Logistic regression dichotomous outcome AUROC (c-statistic) Cox regression time to event data Outcomes of censored patients unknown, constructing ROC impossible Concordance statistic (c-statistic can be easily calculated) same interpretation as AUROC Linear regression continuous outcomes Squared multiple correlation coefficient (R2), aka the explained variance
AUROC Curve Also known as a relative operating characteristic curve The ROC curve illustrates sensitivity and specificity tradeoffs as we vary the cutoff point A plot of the FP probability on the x-axis and the TP probability on the y-axis across several thresholds of a continuous value Each point on the curve represents a Se/Sp pair corresponding to a particular cut-off (decision threshold or criterion value) AUC is the area between the curve and the X-axis 20
Area Under the ROC Curve (AUC) Quantifies the discrimination of the test the probability that, confronted with a pair of randomly chosen patients, one of whom truly has the disease of interest and the other of whom truly does not, the test will accurately identify which of the pair has the disease. The AUC summarizes the whole of the ROC curve, and therefore all parts of the curve are represented within the AUC. http://osctr.ouhsc.edu/Seminar%20Series
Model Performance Measures: Discrimination Binary Outcomes Overall Misclassification (Error) Rate the proportion of observations (over the sample) for which the predicted outcome and actual outcome disagree; Error Rate = (FP + FN)/N Accuracy Rate = 1 misclassification rate False positive and False Negative Rates P^(Y=1|X ) + P^(Y=0|X ) = 1 (where P^(= predicted probability and X=covariates) SAS default : If P^(Y=1>0.5|X ) then Test = 1 (positive) else test = 0 (negative) FP/FN compare actual classification to test classification
Model Performance Measures: Discrimination Tjur R-Squared Also known as Tjur s D or Tjur s coefficient of discrimination Mean difference of the predicted probabilities of the two response levels For each of the two categories of the dependent variable, calculate the mean of the predicted probabilities of an event. Then, take the absolute value of the difference between those two means, that s it! Closely related to R2 definitions for linear models Allison, P. D. Commentary (2014). Measures of fit for logistic regression. In Proceedings of the SAS Global Forum 2014 Conference.
Model Performance Measures: Recalibrating or updating a model Reclassification Measures: Extent to which an extended model improves the classification of participants with and without the outcome compared with the basic model without that predictor. Net Reclassification Improvement (NRI) Quantifies the number of individuals that are correctly reclassified into clinically meaningful higher or lower risk categories with the addition of a new predictor, using pre-specified risk groups [Pencina et al., 2008].
Model Performance Measures: Reclassification Measures Integrated Discrimination Improvement (IDI) In contrast to the NRI, the IDI does not require subjectively predefined risk thresholds. Estimated improvement in the average sensitivity of the basic model with addition of the new predictor minus the estimated decrease in the mean specificity, summarized over all possible risk thresholds. NRI and IDI Potentially useful model performance measures Newer, statistical methods not yet well developed Careful application is necessary
Model Performance Measures: Calibration Quantifying/Assessing Calibration Calibration plot - graph of observed versus predicted probabilities Calibration slope -- < 1 (overfitted); > 1 (underfitted) Goodness of Fit Tests (e.g. Hosmer and Lemeshow) Bland-Altman Calibration Plots with Mean Bias* and SD of Errors Brier Score (Mean Squared Error) Note, overall calibration of a model is generally good in the derivation dataset E.g. mean bias is always 0 for a logistic regression model in the dataset used to derive its coefficients
Model Performance Measures: Calibration How accurate are the predicted probabilities? Break the population into groups (often deciles of risk) Compare actual (observed frequencies) and predicted probabilities for each group Goodness-of-Fit statistical tests (e.g. Hosmer-Lemeshow) provide p- values for the discrepancy between observed and predicted probabilities but no summary estimate of "effect size Large sample size - P-values can be statistically significant even when the calibration is good Small sample size - poor calibration will not be statistically significant
Calibration Plots Grant et al., 2018. Statistical Primer: developing and validating a risk prediction model 28
Model Performance Measures: Calibration The Brier Score Mean squared difference between the predicted probability and the actual outcome. Ranges from 0 (perfect agreement in prediction) to 1 (perfect disagreement in prediction). If the predicted probability is 1 and the outcome occurs, then the Brier Score is 0, the best score achievable. predicted probability is 0.8 and it happens, then the Brier Score is (0.8-1)^2 =0.04. The lower the Brier score is for a set of predictions, the better the predictions are calibrated.
Internal Validation and Shrinkage of the Prediction Model Initial prediction model applied to the data from which it is derived tends to be overly optimistic Overfitting, regression-to-the-mean bias model s predicted probabilities will be too extreme (too high for the diseased and too low for the non- diseased) when the model is applied to new patients; calibration will be poorer and discrimination lower in daily practice [Altman et al., 2009; Moonset al., 2012b]. Amount of overfitting can be estimated and corrected using internal validation methods Split sample and cross-validation one sample used for development and remainder for estimating accuracy Bootstrapping first model is developed on full sample, then multiple random samples are drawn from the full sample - Average optimism in discrimination and calibration can be used to adjust original model (i.e. shrink the model) Heuristic shrinkage factor; penalized estimation methods
Split-sample Validation - - Inefficient Replication instability 31
K-fold cross-validation http://qingkaikong.blogspot.com/ 32
Harrell - Bootstrapping Steps 1. Develop the model using all n subjects and whatever stepwise testing is deemed necessary. Let Capp denote the apparent C from this model, i.e. computed on the same sample used to derive the fit. 2. Generate a sample of size n with replacement from the original sample (for both predictors and the response). 3. Fit the full or possibly stepwise model, using the same stopping rule as was used to derive Capp. 4. Compute the apparent C for this model on the bootstrap sample with replacement. Call it Cboot. 5. Freeze this reduced model, and evaluate its performance on the original dataset. Let Corig denote the C. 6. The optimism in the fit from the bootstrap sample is Cboot Corig. 7. Repeat steps 2 to 6 100-200 times. 8. Average the optimism estimates to arrive at O. 9. The bootstrap corrected performance of the original stepwise model is Capp O.
Internal Validation In general, shrinkage of regression coefficients may improve the performance of a prognostic model substantially. When the sample size is large, no shrinkage will be required, in contrast to a small data set, where a substantial shrinkage may be needed ( Steyerberg & Harrell,2000). If the number of predictors over the number of observations is less than 1/10, shrinkage is necessary, if this ratio is between 1/10 and 1/20, shrinkage is advisable, and if the ratio is smaller than 1/20, shrinkage is not necessary. Internal validation techniques only address pure sampling variability and not changes in patient population Not a substitute for external validation
Penalized Regression Flexible shrinkage approach that is effective when the EPV is low (<10) Aims to fit the same statistical model as standard regression but uses a different estimation procedure Few events - the range of the predicted risks is too wide can be reduced by shrinking the regression coefficients towards zero Penalized regression places a constraint on the values of the regression coefficients Ridge, lasso 36
Penalized Regression Pavlou et al., BMJ 2015;351:h3868 37
Bias in Prognostic Research Confounding is not an issue in prediction research Loss to follow-up (Prognostic) Bias due to indeterminates, missing data Multiple imputation Worst-case sensitivity analysis Ascertainment (Incorporation) bias[Diagnostic/Prognostic] Diagnostic Review bias Test/predictor that is being evaluated is included in the reference standard Test Review Bias
Biases Biases Verification Bias (Diagnostic) When the decision to perform the reference standard depends on the result of the index test (partial verification) When the type of reference standard used depends on the result of the index test (differential verification) Spectrum Bias (Diagnostic/Prognostic) Subjects of dx test study do not have a reasonable spectrum of the condition being tested for and of the non-disease that may mimic it Study population not representative of target population Overfitting Bias (Diagnostic/Prognostic) If you torture data sufficiently, it will confess to almost anything Fred Menger (Newman, EBD) Mainly a problem when a combination of tests is chosen from many candidate tests to identify a disease or predict a prognosis 39
External Validation Aims to address the accuracy of a model in patients from a different but plausibly related population, representing the underlying disease domain. Temporal validation Geographical validation Domain/Setting validation Internal validation alone is limited in determining the generalizability of a prediction model
External Validation: Comparisons Between Derivation and Validation Data Study Population and Variables Patient characteristics and overall outcome rates Outcome definition and ascertainment Selection of diseased and non-diseased otherwise spectrum bias Outcome ascertainment independent of outcome otherwise diagnostic review bias Predictor ascertainment Independent of outcome otherwise incorporation bias Model performance Calibration Hosmer-Lemeshow GOF test; Calibration plot (observed vs predicted); Calibration slope; Brier Score Discrimination AUC (C-statistic); also Tjur R-squared, Error Rate
Presenting the Prediction Model Original untransformed model calculator or computerized patient record Nomogram Decision tree - Classification and Regression Trees (CART) creates a rule such as 'If a patient has finding a, b, or c, they have an XX probability of disease Y'
Presenting the Prediction Model Simplified risk score (SRS) Commonly done using the Framingham Methodology (Sullivan et al., 2004) divide each regression coefficient by the smallest regression coefficient Must be accompanied by the observed disease frequencies across score categories Some loss in dx accuracy, but minimal and easy to use Grobbee & Hoes recommend reporting both the untransformed model and SRS with AUROCs 43
Use of Points System vs Multivariable Models For most risk profiles, there is very good agreement (ICC > 0.9)between the estimates (predicted probabilities) produced by the points system and those produced by the MV models. Divergences occur primarily at the extremes Loss of information is slightly more pronounced when the risk factors are modelled as continuous Sullivan et al., 2004
Model Impact Impact of the risk prediction model on clinical practice. Gold-standard design Randomized, controlled clinical trial comparing patient outcome between randomized groups Care/decisions guided by prediction model Measure health outcome Prediction model Study Sample Randomize Measure health outcome Usual No care/Decisions prediction model 45
Model Impact Net benefit decision curve analysis Grant et al., 2018. Statistical Primer: developing and validating a risk prediction model Vickers, A. J., van Calster, B., & Steyerberg, E. W. (2019). A simple, step-by-step guide to interpreting decision curve analysis. Diagnostic and prognostic research, 3, 18. 46
Applicability of Prediction Models Prediction models often too complex for daily use in clinical settings Diagnostic/prognostic models not routinely validated Tests/factors included in the final model inclusion of advanced tests may lead to a limited applicability Clinicians may find it difficult to include explicit predicted probabilities in their decision making


")