Children's Initial Learning of Probability: A Case Study
Explore a case study on children's initial learning of probability, highlighting challenges, research questions, instructional strategies, and curricular goals derived from the GAISE report. The study focuses on developing probabilistic thinking in elementary students using literature-based teaching strategies.

Download Presentation

Please find below an Image/Link to download the presentation.
The content on the website is provided AS IS for your information and personal use only. It may not be sold, licensed, or shared on other websites without obtaining consent from the author. If you encounter any issues during the download, it is possible that the publisher has removed the file from their server.
You are allowed to download the files provided on this website for personal or commercial use, subject to the condition that they are used lawfully. All files are the property of their respective owners.
The content on the website is provided AS IS for your information and personal use only. It may not be sold, licensed, or shared on other websites without obtaining consent from the author.
E N D
Presentation Transcript
A Case study of Childrens Initial Learning of Probability Authors: Madeline Naumann and Megan Rickards Mentors: Dr. Randall Groth and Dr. Jathan Austin
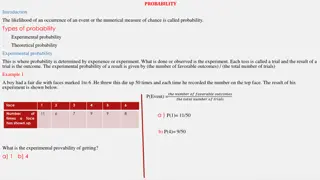
Introduction Research indicates that elementary students face multiple challenges in determining probabilities of an event. Such challenges include: Difficulty in determining theoretical and experimental probabilities (Beck & Huse, 2007) Overcoming incorrect intuitions about probability (Gallego, Saldamando, Taspia- Beltran, Williams, & Hoopingarner, 2009) Analyzing empirical data to predict probabilities of future events and connecting results with everyday situations (Tarr, 2002)
Introduction Purpose: The purpose of this study was to support and study children's initial learning of probability concepts. Specific Research Questions: 1. How do children's initial understandings of probability develop? 2. What sequence of teaching strategies can be used to support the children's development of probabilistic thinking?
Curricular Framework Goals for the instructional sessions we conducted were drawn from the Guidelines for Assessment and Instruction in Statistics Education (GAISE) report (Franklin et al., 2007). According to GAISE, beginning learners of probability should: Understand probability as a measure of the chance of something happening Use words that describe probabilities on a continuum from impossible to certain Informally assign numbers to the likelihood of an occurrence Estimate probabilities using empirical data Develop understanding of the concept of randomness These goals serve to focus children s attention on the concepts of variation and expectation, which are foundational to the development of probabilistic thinking (English & Watson, 2016).
Literature-based Teaching Strategies In our study, we drew upon existing literature to help guide our students toward GAISE goals for the development of probabilistic thinking. Our goal was to help students begin to quantify probabilities through discussion (Edwards & Hensein, 2000). Nicolson (2005) expressed how important it was that students make predictions about an event, record actual results, and then write and discuss their findings. This process helps eliminate faulty intuitions that the students may have. Gallego (2009) suggested that allowing students to solve problems themselves during mathematical investigations helps them develop confidence in their work. By using these methods while teaching, we endeavored to help students progress toward the goals for early probability learning outlined in the GAISE report.
Methodology: Participants Four students, two males and two females, who had all completed fourth grade and were advancing into fifth grade, participated in the nine-week study. For the protection of the students, the following pseudonyms will be used: Joel, Lindsey, Isaac, and Kate. Students were assessed with a 30 minute pre-interview and a 30 minute post-interview and participated in seven weekly one-hour instruction days (Lindsey missed one of the one-hour instruction days).
Analyze student assessment data Gather written and video recorded data from interactions with students Pathways Instructional Cycle Establish student learning goals We progressed through this cycle shown nine times and used it to analyze students reasoning in each lesson. This cycle helped us develop the steps in the research process. Each piece was critical to be completed before advancing to the next step in order to create the most effective lessons for the students. Pose selected task to group of four students Select tasks to move students thinking forward
Methodology: Data Gathering and Analysis Interviews were recorded, transcribed, and analyzed qualitatively. Pre- and post- interviews interviews included the same set of questions to better evaluate students learning. All questions for these interviews were drawn from the National Assessment of Educational Progress. Key tasks from the interviews included:
KEY TASK 1 A person is going to pick one marble without looking. For which dish is there the greatest probability of picking a black marble? Question ID: 2013-4M7 #7 M139401
KEY TASK 2 The balls in this picture are placed in a box and a child picks one without looking. What is the probability that the ball picked will be the one with dots? A.1 out of 4 B.1 out of 3 C.1 out of 2 D.3 out of 4 Question ID: 2013-4M7 #10 M040101
KEY TASK 3 Mark has 9 shirts in his closet as shown. If Mark picks a shirt out of the closet without looking, which two colors have the greatest chance of being picked? A.Blue and purple B.Green and blue C.Red and blue D.Red and green Question ID: 2013-4M7 #2 M170001
KEY TASK 4 Marty has 6 red pencils, 4 green pencils and 5 blue pencils. If he picks out one pencil without looking, what is the probability that the pencil he picks will be green? a. 1 out of 3 b. 1 out of 4 c. 1 out of 15 d. 4 out of 15 Question ID: 2013-4M7 #10 M047001
Methodology: Data Gathering and Analysis Each lesson was recorded using voice recorders and video recorders during the whole hour long lesson. Following each lesson, we transcribed word by word the whole session and noted actions and written work. We then analyzed the students strengths and weaknesses using the videos and transcripts. We coded each student's reasoning using our observations from the lessons and existing descriptions of probabilistic thinking from the literature. Using our qualitative analyses of students' thinking, we made data- based conjectures about how to design each subsequent lesson in a manner that would advance their learning of probability.
Initial Assessment Results During the pre-interviews, each student approached the key interview tasks by using numerous methods. Some examples of prevalent reasoning patterns are shown below. For Key Task 1, Lindsay was able to quantify probability in a conventional manner by saying that the dish with the two white and two black marbles gave her a two out of four chance of picking a black marble. By using one-half to aid her thinking, Lindsay made the connection that the more marbles the dish contains, regardless of colors, the lower the chance there is of picking a certain marble. Joel used an odds ratio approach when asked to determine the likelihood of picking a dotted ball in Key Interview Task 2. Joel chose the answer choice that read one out of three because there s three balls and one dotted. When questioned how many total balls there were, he responded by saying there were three balls altogether and one was dotted. He observed the balls as two distinct groups that have no effect of each other in any way.
Initial Assessment Results Cont. Kate and Isaac both used spatial positioning for Key Interview Task 3 to conclude that probability is based on the placement of the shirts rather than the number of shirts. Both students verbalized similar reasoning by stating that Mark would choose from the middle to grab a shirt. Teacher:Why d you say blue and purple? Kate: Because like they re at-right next to each other and probably like he would pick the middle. Teacher: Alright, and why would he choose from the middle and not on the-like not on the outsides? Kate: Because some people actually choose in the middle. Isaac: Because green and blue are in the middle and when he reaches for the middle and it won t be on the outside. Teacher: Why is he going to reach for the middle? Isaac: Because he wouldn t walk all the way to the other side to get a shirt. He would go right from the middle.
Instructional Cluster 1 Lesson 1:During this lesson we focused on expanding the students probability vocabulary. Students were given a specific event to describe and were to estimate a probability for that event. The students were able to provide reasoning for describing something sure to happen and something that won t happen. Students showed misconceptions in describing an event that was neither certain or impossible. Students also demonstrated an incorrect use of odds ratios. Lesson 2: Students experimented with spinners and representations to determine the greatest chance. Students were also tasked with creating their own representations to express a qualitative description given to them. While the students were able to determine and explain a greater chance probability, some students (specifically Joel and Isaac) still demonstrated using odds ratio in their representations and descriptions:
Lesson 2 Student Ineraction Joel: (holds up spinner that he drew- half is blue and half is purple; there is a total of 4 equal spaces) Teacher: Okay. So tell us about your spinner. Joel: I have two purple and two blue. Teacher: You have two purple and two blue? Oh, so you divided it up into how many parts? Joel: Four. Teacher: Four parts? Okay. So what is my chance of getting a blue? Joel: (blankly stares at his circle) Teacher: What is the probability of me landing on a blue? Joel: (long pause) 2 out of 2.
Instructional Cluster 2 Lesson 3: For this lesson we started having the students compare different expressions of the same probability and match them together in a matching game. During the game, we introduced some word problems. Students had several difficulties with the word problems. For example, odds ratio expressions were used by all the students at this point in the lesson. After using visual representations such as spinners to make sense of word problems, the students were able to correctly express probabilities in a conventional manner. Lesson 4: Students engaged in a math board game where they answered various questions about probability that included representation, part whole reasoning and using conventional quantification. In the beginning of the lesson students were introduced to the possibility of having an unfair spinner where all sections of the spinner are not equal sizes. While the students could determine that the probability of landing on the yellow space was not the same as all the other colors, all students agreed that the probability was still 1 out of 4. Students had trouble in expressing part whole reasoning still, but showed good demonstration in conventional quantification.
Instructional Cluster 3 Lesson 5: Coin and spinner manipulatives were brought into the lesson to help introduce the idea of experimental vs. theoretical prediction. Students brought up the idea that the results were up to chance or luck . Students had a discussion about conventional randomness in terms of flipping a coin and spinning a spinner. Students gave reasonable estimates of what would happen when flipping coins or spinning spinners a given number of times When asked to predict how many times they would land on the colors of a spinner with 3 equal sections of red, yellow and blue, all students except for Isaac gave an answer similar to the one shown in the student work sample above.
Instructional Cluster 3 Cont. Lesson 6: Students were introduced to dice as a manipulative and discussed what the probability of landing on each side was and predict how many times they would land on a specific side if rolled 60 times. Students began introducing the idea of allowing variation in their experiments and their predictions. Part whole reasoning was used correctly by all of the students. Lesson 7: Loaded dice were presented to the students and they were asked to roll them to determine if the probability of rolling a 1 was the same as the probability of rolling a 1 on the previous lesson s dice. As a group, students were able to agree that the loaded dice were not fair. Students were given word problems and asked to find various probabilities. The students compared probabilities, represented informal qualitative descriptions of events, and wrote conventional quantifications of probabilities.
Post-assessment Results By the end of the nine week study, each student had demonstrated a significant amount of progress as seen in the post interviews. For Key Task 1, Lindsay again used one-half as a benchmark as she did in the pre-interview. She represented probabilities as fractions with little difficulty. When using fractions to assist her reasoning, she was able to justify her answer and verbalize that even though there are less marbles in option A, there is still a greater probability of picking a black marble.
Post-assessment Results Cont. Instead of Joel using an odds ratio approach when asked to determine the probability of picking a ball with dots (Key Task 2), he expressed probability as a fraction. Joel was able to justify his answer by stating there s one dot and four in all leading him to his decision of one out of four. While Isaac was still having difficulty with spatial positioning in Key Task 3, Kate indicated growth by attempting to quantify amounts of each colored shirt. Even though she answered incorrectly, she was no longer using the placement of the shirts as a basis for her final answer. Instead, she calculated the amount of each shirt color and considered it as a deciding factor when determining a final answer. By evaluating her answers from the pre-interview to the post- interview, Kate shows more consistency in representing probabilities with fractions.
Reflection and Discussion After analyzing student reasoning and data we collected, it was apparent that achieving the various NCTM and GAISE standards can be very challenging for elementary school students. Students in our study were eventually able to express probabilities in different ways such as qualitative language, fractions, and percents. We concluded that the best way for students to understand probability is to predict and investigate in the context of experiments involving data collection. We also found that when students were prompted to think on their own and not in a group, things became more challenging for them. Some students struggled to focus on what the question was asking while others had trouble representing probabilities. By the end of the nine weeks, it was evident that students were beginning to become familiar with basic probability, the language associated with it, and the numerous ways it can be expressed. While the words chance and random were mentioned in the nine weeks, there was not enough time to fully expand on these ideas. Spending more time on these ideas may have built students understanding of probability by eliminating common misconceptions and associations for these words. For students to grasp the concept of probability, it is important they are continually exposed to it. The task sequence that we implemented over the course of this study helped not only to introduce probability to students but to illustrate how to satisfy the various standards and guidelines that teachers need to follow in order to help each student develop probabilistic understanding.
References Beck, S. A., & Huse, V. E. (2007). A virtual spin on the teaching of probability. Teaching Children Mathematics, 13(9), 482-486. Edwards, T.G., & Hensien, S.M. (2000). Using probability experiments to foster discourse. Teaching Children Mathematics, 6(8), 524-29. English, L.D., & Watson, J.M. (2016). Development of probabilistic understanding in fourth grade. Journal for Research in Mathematics Education, 47, 28-62. Franklin, C., Kader, G., Mewborn, D., Moreno, J., Peck, R., Perry, M., & Schaeffer, R. (2007). Guidelines for assessment and instruction in statistics education (GAISE) report: A PreK-12 curriculum framework. Alexandria, VA: American Statistical Association. Gallego, C., Saldamando, D., Tapia-Beltran, G., Williams, K., & Hoopingarner, T.C. (2009). Probability. Teaching Children Mathematics, 15(7) , 416-417. Nicolson, C.P. (2005). Is chance fair? One student s thoughts on probability. Teaching Children Mathematics, 12(2), 83-89 Tarr J., E. (2002). Providing opportunities to learn probability concepts. Teaching Children Mathematics, 8(8), 482-487.