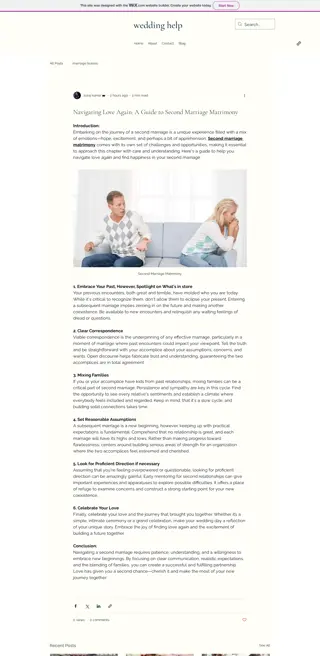
Changing Trends in Weddings: A Modern Outlook on Matrimony


Many Weddings Are
Changing with the Times
Many of the trends that have “disrupted” the traditional
wedding industry continue and are intensifying. For
example, the average age of men and women being
married are still the oldest since 1950, or 29.8 and 27.8
years, respectively.
Most marriages still retain many traditions, but they are
being personalized and more cultural customs are being
added. Many of these changing attitudes caused a slight
decrease in the number of marriages during 2018, to
2.20 million.
Total 2018 wedding industry sales were $54.4 billion, a
3.4% decrease from 2017. According to The Wedding
Report, the average 2018 wedding cost $24,723, a 4.0%
decrease from 2017.
A Proposal Is the First Step
According to a 2019 survey from The Knot, 71% of
respondents dated for more than 2 years before a formal
engagement. A 2019 WeddingWire survey found most
couples are engaged for more than a year and the
average engagement is 14 months.
With all this time together before and after the proposal,
it’s not surprising that 87% of engagements are pre-
planned and 40% 1 to 3 months in advance and 17% 4 to
6 months in advance.
Almost half (45%) of engagement rings are custom-
designed, but the tradition of a diamond as the primary
stone continues for 71% of couples. WeddingWire reports
20% of couples choose the ring together and 50%
purchase it at a brick-and-mortar store.
Most Registries Are Online
The majority (60%) of wedding registries are now
online, according to The Knot 2019 Wedding Registry
Study, compared to 33% during 2013, and essentially all
couples, or 97%, are using digital technologies to
manage their registries.
More couples are creating honeymoon registries, which
have increased almost 300% since 2010 to 29% of
couples, according to The Knot. Couples are receiving
an average of $1,562 for their honeymoon registries
from guests.
Couples also create cash registries and receive an
average contribution of $1,863 from all guests. Most of it
(55%) is applied to honeymoon-related expenses, with
food and drink experience, 15%; household-related
expenses, 15%; and hobbies/interests, 9%.
The Last Celebration
as a Single Adult
Most bachelor and bachelorette parties occur during the
spring, or 43%, while 42% of bachelor and 35% of
bachelorette parties occur during the summer. Slightly
more men than women plan a party of two or more days,
or 60%+ and 50%+, respectively.
Although a 3-day bachelor party can cost a guest $1,144
on average and a 3-day bachelorette party guest, $773,
19% of bachelor party guests and almost 40% of
bachelorette party guests spent $200 or less.
The top 5 bachelor party locations, according to
WeddingWire’s 2018 Bachelor & Bachelorette Study,
were Las Vegas, Miami, New York City, Los Angeles and
Chicago. For bachelorette parties, Las Vegas, Los
Angeles, New York City, Miami and Nashville.
Wedding Costs Are Still Challenging
Although different methodologies resulted in The Wedding
Report’s average 2018 wedding cost of $24,723,
compared to The Knot’s $33,931, this significant expense
may conflict with the realities of student loan debt and a
home purchase for many couples.
These other realities may be why just 9% of couples paid
for their entire 2018 weddings, although 91% shouldered
some of the expenses. The venue, catering and event
rentals often cost the most, or $12,355 on average,
according to The Wedding Report.
When searching for and selecting vendors, reviews and
photos are important for couples, with 80% considering
reviews very important. According to WeddingWire, the
average couple hires 14 vendors, with photography the
top vendor, at 90%.
Celebrating the “Day of Days”
According to the WeddingWire 2019 Newlywed
Report, 65% of couples dressed with their wedding
party, 60% had a ringbearer and/or flower girl, 63% of
bridesmaids wore different dresses and 28%
participated in a pre-wedding activity, such as golf.
For the ceremony, most fathers (77%) still escorted
either the bride or groom or both down the aisle, 70%
of ceremonies were less than 30 minutes, 44% of
couples wrote their vows and 25% occurred in a
religious institution.
During the reception, the most popular tradition was
the couples’ first dance (92%) while 79% incorporated
their wedding colors into their florals, 47% gave a
speech and 36% displayed a wedding hashtag for
guests to share images on social media.
Advertising Strategies
Because more couples want more personalized,
culturally-specific and multi-day weddings/celebrations,
professional wedding planners/designers have
opportunities to gain a greater share of this market with
proactive advertising campaigns/messages.
Retailers who sell wedding dresses can steal market
share from their competitors by offering a package of
wedding-day clothing ensembles for brides as more of
them are wearing different fashions throughout the day.
Local venues, resorts and adult entertainment facilities
may be able to attract more bachelor and bachelorette
parties by offering special and/or localized amenities and
activities unavailable in Las Vegas, Miami and other
traditional cities for these parties.
New Media Strategies
Stores that sell products appropriate for wedding
registries may want to create a gift guide with a series of
short videos or other social media posts featuring those
products and possibly offering a discount to
customers/guests who present their wedding invitation.
Stores that market to the wedding audience can
incentivize customers to share photos/videos from their
weddings on social media, especially to highlight such
trends as pets as members of the wedding party, the
incorporation of ethnic elements, etc.
Local wedding-related retailers/businesses can promote
the charities/nonprofits they support to couples and
families with social media posts, especially as more
couples, especially Gen Zers, consider giving-back an
important element of their weddings.
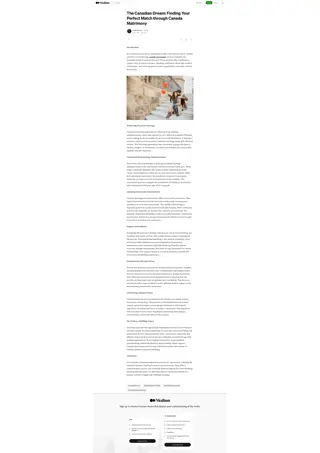
Weddings are evolving with the times, as seen through changing trends such as personalized traditions, online registries, and elaborate bachelor/bachelorette parties. Couples are taking more time before getting engaged and customizing their rings and celebrations to reflect their unique styles. Despite slight decreases in marriage rates and industry sales, the essence of love and commitment remains at the core of these evolving ceremonies.

Download Presentation

Please find below an Image/Link to download the presentation.
The content on the website is provided AS IS for your information and personal use only. It may not be sold, licensed, or shared on other websites without obtaining consent from the author. Download presentation by click this link. If you encounter any issues during the download, it is possible that the publisher has removed the file from their server.
E N D
Presentation Transcript
Many Weddings Are Changing with the Times Many of the trends that have disrupted the traditional wedding industry continue and are intensifying. For example, the average age of men and women being married are still the oldest since 1950, or 29.8 and 27.8 years, respectively. Most marriages still retain many traditions, but they are being personalized and more cultural customs are being added. Many of these changing attitudes caused a slight decrease in the number of marriages during 2018, to 2.20 million. Total 2018 wedding industry sales were $54.4 billion, a 3.4% decrease from 2017. According to The Wedding Report, the average 2018 wedding cost $24,723, a 4.0% decrease from 2017.
A Proposal Is the First Step According to a 2019 survey from The Knot, 71% of respondents dated for more than 2 years before a formal engagement. A 2019 WeddingWire survey found most couples are engaged for more than a year and the average engagement is 14 months. With all this time together before and after the proposal, it s not surprising that 87% of engagements are pre- planned and 40% 1 to 3 months in advance and 17% 4 to 6 months in advance. Almost half (45%) of engagement rings are custom- designed, but the tradition of a diamond as the primary stone continues for 71% of couples. WeddingWire reports 20% of couples choose the ring together and 50% purchase it at a brick-and-mortar store.
Most Registries Are Online The majority (60%) of wedding registries are now online, according to The Knot 2019 Wedding Registry Study, compared to 33% during 2013, and essentially all couples, or 97%, are using digital technologies to manage their registries. More couples are creating honeymoon registries, which have increased almost 300% since 2010 to 29% of couples, according to The Knot. Couples are receiving an average of $1,562 for their honeymoon registries from guests. Couples also create cash registries and receive an average contribution of $1,863 from all guests. Most of it (55%) is applied to honeymoon-related expenses, with food and drink experience, 15%; household-related expenses, 15%; and hobbies/interests, 9%.
The Last Celebration as a Single Adult Most bachelor and bachelorette parties occur during the spring, or 43%, while 42% of bachelor and 35% of bachelorette parties occur during the summer. Slightly more men than women plan a party of two or more days, or 60%+ and 50%+, respectively. Although a 3-day bachelor party can cost a guest $1,144 on average and a 3-day bachelorette party guest, $773, 19% of bachelor party guests and almost 40% of bachelorette party guests spent $200 or less. The top 5 bachelor party locations, according to WeddingWire s 2018 Bachelor & Bachelorette Study, were Las Vegas, Miami, New York City, Los Angeles and Chicago. For bachelorette parties, Las Vegas, Los Angeles, New York City, Miami and Nashville.
Wedding Costs Are Still Challenging Although different methodologies resulted in The Wedding Report s average 2018 wedding cost of $24,723, compared to The Knot s $33,931, this significant expense may conflict with the realities of student loan debt and a home purchase for many couples. These other realities may be why just 9% of couples paid for their entire 2018 weddings, although 91% shouldered some of the expenses. The venue, catering and event rentals often cost the most, or $12,355 on average, according to The Wedding Report. When searching for and selecting vendors, reviews and photos are important for couples, with 80% considering reviews very important. According to WeddingWire, the average couple hires 14 vendors, with photography the top vendor, at 90%.
Celebrating the Day of Days According to the WeddingWire 2019 Newlywed Report, 65% of couples dressed with their wedding party, 60% had a ringbearer and/or flower girl, 63% of bridesmaids wore different dresses and 28% participated in a pre-wedding activity, such as golf. For the ceremony, most fathers (77%) still escorted either the bride or groom or both down the aisle, 70% of ceremonies were less than 30 minutes, 44% of couples wrote their vows and 25% occurred in a religious institution. During the reception, the most popular tradition was the couples first dance (92%) while 79% incorporated their wedding colors into their florals, 47% gave a speech and 36% displayed a wedding hashtag for guests to share images on social media.
Advertising Strategies Because more couples want more personalized, culturally-specific and multi-day weddings/celebrations, professional wedding planners/designers have opportunities to gain a greater share of this market with proactive advertising campaigns/messages. Retailers who sell wedding dresses can steal market share from their competitors by offering a package of wedding-day clothing ensembles for brides as more of them are wearing different fashions throughout the day. Local venues, resorts and adult entertainment facilities may be able to attract more bachelor and bachelorette parties by offering special and/or localized amenities and activities unavailable in Las Vegas, Miami and other traditional cities for these parties.
New Media Strategies Stores that sell products appropriate for wedding registries may want to create a gift guide with a series of short videos or other social media posts featuring those products and possibly offering a discount to customers/guests who present their wedding invitation. Stores that market to the wedding audience can incentivize customers to share photos/videos from their weddings on social media, especially to highlight such trends as pets as members of the wedding party, the incorporation of ethnic elements, etc. Local wedding-related retailers/businesses can promote the charities/nonprofits they support to couples and families with social media posts, especially as more couples, especially Gen Zers, consider giving-back an important element of their weddings.