Challenges in Promoting Organic Farming in India
The agro-ecological movement in India faces challenges in scaling up organic farming due to limited government support, lack of scientific consensus, and reliance on chemical-intensive agriculture. Despite some initiatives like the Paramparagat Krishi Vikas Yojana, implementation remains suboptimal. The recent shift towards natural farming by the government highlights the need for a mass movement, yet significant hurdles hinder progress.
Download Presentation

Please find below an Image/Link to download the presentation.
The content on the website is provided AS IS for your information and personal use only. It may not be sold, licensed, or shared on other websites without obtaining consent from the author.If you encounter any issues during the download, it is possible that the publisher has removed the file from their server.
You are allowed to download the files provided on this website for personal or commercial use, subject to the condition that they are used lawfully. All files are the property of their respective owners.
The content on the website is provided AS IS for your information and personal use only. It may not be sold, licensed, or shared on other websites without obtaining consent from the author.
E N D
Presentation Transcript
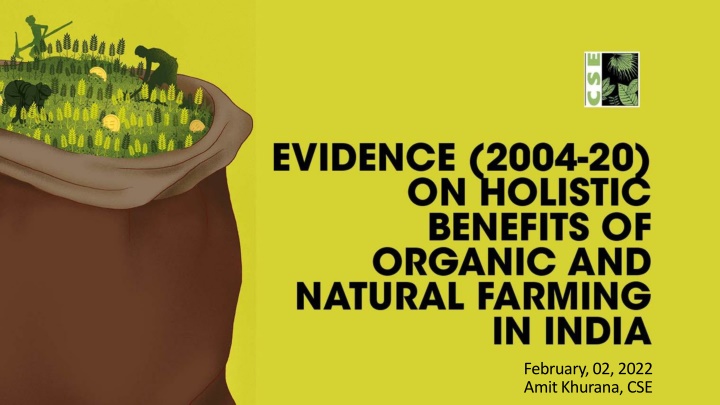
February, 02, 2022 Amit Khurana, CSE
Why this report? Why this report? Agro-ecological movement started gaining momentum after negative impacts of Green Revolution - an input and chemical intensive agriculture model - were evident First policy on organic farming in 2005, but subsequent action half- hearted Paramparagat Krishi Vikas Yojana (PKVY; started in 2015-16) has implementation challenges and is limited in scale Action at the state has been suboptimal barring few exceptions Explains why only 2.7 per cent (3.8 million ha) of net sown area (140.1 million ha) in India is covered under organic and natural farming as part of different policies. This includes 0.41 million ha of natural farming
Why this report? Why this report? One main reason of half-hearted effort is the lack of conviction among policy makers. Largely due to: Limited consensus among the scientific community in favour of organic and natural farming Singular view of yield to assess these non-chemical agricultural practices Both attributed to limited evidence, which was building up over the last two decades but failed to catch the attention of policymakers In a recent shift, the government started talking publicly in favour of organic and natural farming. The Prime Minister highlighted ill-effects of chemical-based farming and appealed to make natural farming a mass movement in the country; but yesterday s budget speech suggests no big move.
Approach to collection, analysis and Approach to collection, analysis and presentation of evidence presentation of evidence
Collection of evidence Collection of evidence (2004 (2004 2020) 2020) 1. All India-Network Project on Organic Farming (AI-NPOF) Conducted by ICAR through Indian Institute of Farming System Research (IIFSR), Modipuram Started in 2004-05 at 13 centres in 12 states. Ongoing at 20 centres in 16 states, in five ecosystems arid, semi-arid, humid, sub-humid and coastal Results of 74 cropping systems at 19 centres are used (2004-19) Three approaches Organic approach (ORG) management Organic innovative method (OIN), with 75 per cent of the nutrients from organic sources + innovative inputs 25 per cent [any two of cow urine (10 per cent), panchagavya, plant growth-promoting rhizobacteria and vermiwash (10 per cent)] Integrated approach (INT) Integrated method (IN50), with 50 per cent organic + 50 per cent inorganic nutrients and management Inorganic approach (INO) State recommended (SR) method or farmers' package (choice given to centres) Six methods Organic method (OF), with 100 per cent of the nutrients from organic sources and complete organic Integrated method (IN75), with 75 per cent organic + 25 per cent inorganic nutrients and management Inorganic method (IOF), with 100 per cent inorganic nutrients and management 2. Scientific studies on Organic and Natural farming: 89 unique scientific studies published in India during 2010-20 by a wide set of stakeholders
AI-NPOF centres and ecosystems Centres States Ecosystems Humid Semi-arid Coastal Semi-arid Arid Bajaura Bhopal Calicut Coimbatore Dharwad Himachal Pradesh Madhya Pradesh Kerala Tamil Nadu Karnataka Jabalpur Madhya Pradesh Sub-humid Karjat Ludhiana Modipuram Pantnagar Raipur Ranchi Umiam Ajmer Almora Gangtok Narendrapur Sardarkrushinagar Thiruvananthapuram Udaipur Maharashtra Punjab Uttar Pradesh Uttarakhand Chhattisgarh Jharkhand Meghalaya Rajasthan Uttarakhand Sikkim West Bengal Gujrat Kerala Rajasthan Coastal Semi-arid Semi-arid Humid Sub-humid Sub-humid Humid Arid Sub-humid Sub-humid Humid Arid Coastal Semi-arid
Analysis (AI Analysis (AI- -NPOF results) NPOF results) Results analysed in one or more of the following ways w.r.t yield, income and livelihood , soil health and environment and food quality and nutrition 1. Based on mean values (2014-19): Five-year mean values of organic approach and integrated approach compared with inorganic approach. Also done for six methods Analysis also done to know crops/cropping systems with significantly higher (>20 per cent) mean values and ascertain cropping systems with highest mean value 2. Based on actual values (during 2014-19 and/or 2018-19): Analysis to know number of times actual values were highest (e.g. crops, food quality parameters, micronutrients) 3. Long-term trends (2004 19): Data points for 2004-11, and for the subsequent years Out of six, three methods added 2013 -14 onwards Presented as graphs in annexure
Presentation (snapshot) Presentation (snapshot) Table comparing mean yield values of organic and integrated with inorganic method and approaches
Graphs showing centre wise long-term trends for net returns (Rs/hectare) Presentation (snapshots) Presentation (snapshots) Graphs showing higher and significantly higher mean values (> 20 per cent) in comparison with inorganic Graphs showing centre wise long-term trends for organic carbon (per cent)
Analysis and presentation of evidence (scientific studies on Analysis and presentation of evidence (scientific studies on organic and natural farming) organic and natural farming) Segregated under multiple headings across separate chapters along with AI-NPOF results in four sections of the report Crop yield: Higher yield with organic farming and natural farming Transition time to attain comparable or higher yields with organic farming Cost, income and livelihood: Cost of cultivation with organic and natural farming Price, income and livelihood with organic and natural farming Soil health and environment: Benefits of organic and natural farming on soil health Impact of organic and natural farming on climate and environment Evidence on food quality and nutrients: Benefits of organic farming on food quality and nutrition
Evidence on Crop Yield Evidence on Crop Yield
Select 31 crops across five food groups Select 31 crops across five food groups Grown as part of 74 cropping systems; 19 centres; five ecosystems; three seasons (Kharif, Rabi, Summer) Vegetables (10): Broccoli, potato, French bean, vegetable pea, tomato, cauliflower, chillies, onion, capsicum and ladyfinger Oilseeds (5): linseed, groundnut, mustard, sunflower and soybean Pulses (6): Black gram, pigeon pea, chickpea, green gram, cowpea and lentils Spices (5): Ginger, turmeric, coriander, fennel and black pepper Cereals (5): Basmati rice, rice, wheat, durum wheat and maize
Productivity (crop yield): summary based on AI Productivity (crop yield): summary based on AI- -NPOF results NPOF results % times where organic or integrated approaches showed significantly higher yield (>20 per cent) than inorganic (% of overall higher yield, based on mean values) Instances where yields are highest with each of the three farming approaches (in %, based on actual values) % times where organic or integrated approaches showed higher yield than inorganic (in %, based on mean values) Food groups (no. of recorded results) Range of difference in mean with inorganic approach (INO=IOF+SR) (in %) ORG: -18 62 INT: -15 59 Vegetables (122) ORG: 48; INT: 36; INO: 16 ORG: 70; INT: 63 ORG: 29; INT: 42 ORG: -16 39 INT: -5 25 Oilseeds (91) ORG: 58; INT: 17; INO: 25 ORG: 45; INT: 45 ORG: 10; INT: 20 ORG: -29 66 INT: -33 109 Pulses (81) ORG:32; INT:42; INO: 26 ORG: 67; INT: 62 ORG: 21; INT: 54 ORG: -31 46 INT: -9 48 Spices (28) ORG: 32; INT: 54; INO: 14 ORG: 63; INT: 88 ORG: 80; INT: 43 ORG: -22 88 INT: -18 59 Cereals (182) ORG: 35; INT: 32; INO: 33 ORG: 22; INT: 37 ORG: 27; INT: 17
Key highlights Key highlights Out of the 504 times that yield results were recorded during 2014 19, 41 per cent of the times yields were highest with organic approach, followed by 33 per cent with integrated and 26 per cent with inorganic approach When five-year mean yields (2014-19) are compared, in 27 out of 31 crops (87 per cent) yields were higher with organic approach than with inorganic approach as part of one or more cropping systems Long-term trends revealed that Organic approach is better than Inorganic and is at par with Integrated.
Key highlights (from scientific studies on organic and natural farming) Key highlights (from scientific studies on organic and natural farming) Higher yield with organic farming and natural farming Organic farming Compared to chemical based farming, yields are higher with organic in crops - Spinach, baby corn, broccoli, potato, ladyfinger, tomato, onion, chilli, pigeon pea, cowpea, black gram, rice, ragi, pearl millet, wheat, and banana Natural farming Crops like maize, groundnut, sugarcane, finger millet, soybean, jowar and turmeric showed higher yields with natural farming Transition time to attain comparable or higher yield with organic farming Yields usually improve over time with organic inputs and bio-inputs (although yields may reduce during the transition phase) Some crops may take more years than others to attain higher or comparable yields - wheat, maize, rice, cluster bean, sesame, cumin, and psyllium husk
Evidence on Cost, Income and Livelihood Evidence on Cost, Income and Livelihood
Profitability (cost, income and livelihood): summary based on AI Profitability (cost, income and livelihood): summary based on AI- - NPOF results NPOF results Upto 63 cropping systems; 17 centres; five ecosystems % of cropping systems showing higher mean values with organic or integrated approaches over inorganic % of cropping systems showing significantly higher (>20 per cent) mean values with organic or integrated approaches over inorganic (% of overall higher) % of cropping systems showing highest mean values with each of the three approaches Range of difference in mean with inorganic approach (INO=IOF+SR) (in %) Cost, income and profitability ( no. of cropping systems) Cost of cultivation (63) ORG: -24 72 INT: -26 51 ORG: 63; INT: 8; INO: 29 ORG: 81; INT: 71 ORG: 67; INT: 36 ORG: -24 97 INT: -22 125 Gross returns (61) ORG: 49; INT: 15; INO: 36 ORG: 74; INT: 67 ORG: 82; INT: 20 ORG: -145 370 INT: -99 395 Net returns (61) ORG: 64; INT: 11; INO: 25 ORG: 67; INT: 56 ORG: 88; INT: 12 Benefit-cost ratio (61) ORG: -55 171 INT: -37 69 ORG: 21; INT: 13; INO: 66 ORG: 56; INT: 34 ORG: 53; INT: 29
Key highlights Key highlights Out of 61 cropping systems, net returns are highest in 64 per cent with organic approach at 12 centres, 11 per cent with integrated approach at four centres, and 25 per cent with inorganic approach at five centres. The five-year mean net returns with organic approach are higher than inorganic in 67 per cent cropping systems. Similarly, mean net returns with integrated approach are higher than inorganic in 56 per cent cropping systems. Despite high cost of cultivation in 51 cropping systems (81 percent) (largely due to purchase of on-farm organic inputs for experimental farms), net returns are highest in 63 per cent of these cropping systems The long-term trends revealed that net returns are much better with Organic than Inorganic approach and also better than Integrated approach
Key highlights (from scientific studies on organic and natural farming) Key highlights (from scientific studies on organic and natural farming) Cost of cultivation with organic and natural farming Cost of inputs are comparatively less as these are locally and naturally available Major cost comes as manual labour and production of vermicompost Price, income and livelihood with organic and natural farming Organic farming Provides sustained livelihood for marginal farmers due to low cost of cultivation, intercropping, labour requirements, and comparatively good market rates Natural farming Minimized cost, helps fetch premium prices Higher income and profit than conventional farming Benefit-cost ratio is several times higher than chemical-based farming Has potential to provide year-long sustained food production for consumption and sales
Evidence on Soil Health and Environment Evidence on Soil Health and Environment
Sustainability Sustainability (soil health and environment): summary based on AI (soil health and environment): summary based on AI- -NPOF results NPOF results Organic carbon: nine centres (five ecosystems); Available N, P, and K: 16 centres (five ecosystems) % of cropping systems showing higher mean values with organic or integrated approaches over inorganic % of cropping systems showing significantly higher (>20 per cent) mean values with organic or integrated approach over inorganic (% of overall higher) % of cropping systems showing highest mean values with each of the three approaches Range of difference in mean with inorganic approach (INO=IOF+SR) (in %) Soil health parameters (no. of cropping systems) ORG: 0 241.8 INT: -2.50 195.1 Organic Carbon (34) ORG: 91; INT: 9; INO: 0 ORG: 97; INT: 94 ORG: 67; INT: 44 Available Nitrogen N (58) ORG: -24.7 40.2 INT: -23.3 38.5 ORG: 57; INT: 21; INO: 22 ORG: 74; INT: 62 ORG: 12; INT: 11 Available Phosphorus - P (62) ORG: -46.3 242.6 INT: -280.8 232.2 ORG: 58; INT: 23; INO: 19 ORG: 74; INT: 69 ORG: 52; INT: 47 Available Potassium K (62) ORG: -8.1 95.5 INT: -12.1 101.4 ORG: 53; INT: 28; INO: 19 ORG: 69; INT: 76 ORG: 21; INT: 13
Key highlights Key highlights Organic carbon, available nitrogen, phosphorus, potassium in soil are better with organic approach than with integrated and inorganic approaches Soil organic carbon Out of 34 cropping systems at nine centres, mean organic carbon in soil is highest in 91 per cent cropping systems with organic approach at all centres. The five-year mean organic carbon, with organic approach is higher than inorganic in 97 per cent cropping systems. Long-term trends: Organic carbon (OC) is highest throughout with Organic approach at all nine centres Available nitrogen, phosphorus and potassium, collectively Mean values of all three macronutrients with organic approach are higher than with inorganic approach in 26 cropping systems (42 per cent) at 10 centres.
Key highlights Key highlights Available nitrogen in soil Out of 58 cropping systems at 15 centres, mean available nitrogen is highest in 57 per cent cropping systems with organic approach at 12 centres. It is highest in 21 per cent with integrated approach at eight centres and in 22 per cent with inorganic approach at four centres. The five-year mean available nitrogen with organic approach is higher than inorganic in 74 per cent cropping systems. Similarly, with integrated approach, it is higher than inorganic in 62 per cent cropping systems. Available phosphorus in soil Out of 62 cropping systems at 16 centres, mean available phosphorus is highest in 58 per cent cropping systems at 13 centres with organic approach. It is highest in 23 per cent with integrated approach at eight centres and in 19 per cent with inorganic approach at five centres. The five-year mean available phosphorus with organic approach is higher than inorganic in 74 per cent cropping systems. Available potassium in soil Out of 59 cropping systems at 16 centres, mean available potassium is highest in 53 per cent cropping systems at 12 centres with organic approach. It is highest in 28 per cent with integrated approach at eight centres and in 19 per cent with inorganic approach at five centres. The five-year mean available potassium with organic approach is higher than inorganic in 69 per cent cropping systems.
Sustainability Sustainability (soil and environment): summary based on AI (soil and environment): summary based on AI- -NPOF results NPOF results Bulk density: seven centres (five ecosystems); rhizosphere microbial population (except PSB): eight centres (five ecosystems); PSB: six centres (five ecosystems) % of cropping systems showing higher mean values with organic or integrated approaches over inorganic % of cropping systems showing significantly higher (>20 per cent) mean values with organic or integrated approach over inorganic (% of overall higher) Range of difference in mean with inorganic approach (INO=IOF+SR) (in %) % of cropping systems showing highest mean values with each of the three approaches Soil health parameters (no. of cropping system) ORG: -9.3 6.5 INT: -8.6 4.5 Bulk density* (28) ORG: 52; INT: 34; INO: 14 ORG: 75; INT: 79 ORG: 0; INT: 0 ORG: -68 274.3 INT: -24.9 191.6 Bacteria (32) ORG: 84; INT: 13; INO: 03 ORG: 91; INT: 81 ORG: 86; INT: 65 ORG: -65.6 173.3 INT: -66.3 55.6 Fungi (32) ORG: 72; INT: 13; INO: 16 ORG: 78; INT: 66 ORG: 76; INT: 52 Soil actinomycetes (32) ORG: 56.2 100.7 INT: 42.5 238.1 ORG: 69; INT: 25; INO: 06 ORG: 84; INT: 34 ORG: 56; INT: 73 Phosphate solubilizing bacteria (PSB) (32) ORG: -83.8 307.4 INT: -45.9 1496.3 ORG: 76; INT: 10; INO: 14 ORG: 81; INT: 19 ORG: 47; INT: 50 (*values reflect lowest and lower instead of highest and higher)
Key highlights Key highlights Soil bulk density Out of 28 cropping systems at seven centres, mean bulk density is lowest in 52 per cent cropping systems with organic approach at four centres. It is lowest in 34 per cent cropping systems with integrated approach at four centres and it is lowest in 14 per cent with inorganic approach at two centres. The five-year mean bulk density with organic approach is lower than inorganic in 75 per cent cropping systems. Soil bacteria, fungi, actinomycetes and phosphate solubilizing bacteria Collectively, mean values of bacteria, fungi and soil actinomycetes with organic approach are higher than with inorganic approach in 21 cropping systems (about 66 per cent) at eight centres. In the case of integrated approach, it is higher than inorganic approach in five cropping systems (about 17 per cent) at two centres.
Sustainability Sustainability (soil and environment): summary based on AI (soil and environment): summary based on AI- -NPOF results NPOF results Collectively, values of all four micronutrients with organic approach are higher than inorganic approach in 16 cropping systems (76 per cent) at five centres (three ecosystems) % of cropping systems showing higher mean values with organic or integrated approaches over inorganic % of cropping systems showing significantly higher (>20 per cent) mean values with organic or integrated approach over inorganic (% of overall higher) Range of difference in mean with inorganic approach (INO=IOF+SR) (in %) Soil health parameters* (no. of cropping systems) % of cropping systems showing highest mean values with each of the three approaches ORG: -20.3 86.6 INT: 0.0 65.1 Iron (19) ORG: 74; INT: 21; INO: 5 ORG: 90; INT: 100 ORG: 65; INT: 53 ORG: -0.3 58.4 INT: 7.6 55.9 Manganese (19) ORG: 63; INT: 37; INO: 0 ORG: 90; INT: 100 ORG: 71; INT: 58 ORG: 18.9 341.2 INT: 9.1 250 Zinc (19) ORG: 89; INT: 11; INO: 0 ORG: 100; INT: 100 ORG: 89; INT: 72 ORG: -2.3 133.2 INT: -218.5 66.4 Copper (19) ORG: 78; INT: 22; INO: 0 ORG: 89; INT: 61 ORG: 50; INT: 46 * Results are based on actual values for 2018-19
Key highlights (from scientific studies on organic and natural farming) Key highlights (from scientific studies on organic and natural farming) Benefits on soil health Organic farming Leads to active organic matter and microorganisms, increases soil fertility Manures improves soil health and fertility - improves soil structure, fertility, organic carbon, bulk density, soil moisture, porosity, water holding capacity, plant and animal biodiversity Natural farming Increases soil health and fertility - increases macro and micro nutrients, organic carbon, soil enzymes, earthworms, soil respiration, microbial biomass, soil porosity, aeration, light texture, moisture retention Impact on climate and environment Organic farming Improves sustainability index and increases carbon sequestration Natural farming Improves overall resilience of crops to adverse climatic conditions, improves energy and water efficiency, has high potential to reduce carbon emission, prevents over extraction of ground water
Evidence on Food Quality and Nutrients Evidence on Food Quality and Nutrients
Key highlights: AI Key highlights: AI- -NPOF and scientific studies NPOF and scientific studies AI-NPOF: Actual values 2018-19, of 28 different food quality and nutrient parameters were analyzed in 15 crops from five groups Vegetables, Oilseeds, Pulses, Spices and Cereals In 12 out of 15 crops, parameters tested were highest with organic approach Values with organic approach were higher than inorganic in 67 per cent cases (across 51 sets of test results); with integrated, it was higher in 64 per cent cases Scientific studies: Additional food quality and nutrition parameters were better with organic farming Organic farming also improved the physical attributes; showed higher nutritive values than their conventionally grown counterparts; have higher disease fighting antioxidants
Conclusion Conclusion
It is clear that the consolidated holistic evidence is in favour of organic and natural farming over chemical-dependent inorganic farming. Organic and natural farming approaches are not only profitable and sustainable but also productive . It is also evident that organic approach has fared better than integrated approach on profitability and sustainability and is at par with it in the case of productivity It is also clear that the strength of this consolidated evidence is high. It is holistic, comprehensive and robust. (covers almost all relevant aspects; both organic and natural farming; multiple dimensions within each; compares organic with inorganic and integrated both) It is also clear that one major part of this evidence, which is developed based on results of the AI-NPOF, failed to receive the attention that it deserved by policy makers and larger scientific community at the centre as well as in states.
Recommendations Recommendations 1. It is critical that the evidence consolidated is well recognized and accepted by the larger scientific community, which can play a big role in spreading awareness, building capacity and influencing policymakers 2. It is important that the holistic evidence consolidated on organic and natural farming is considered, while assessing their benefits and advantages, instead of just focusing singularly on yield 3. All ongoing and future action should be aligned and informed by the strong evidence consolidated in favour of organic and natural farming 4. Develop a roadmap that sets the long-term agenda for adoption of agro-ecological approaches across different parts of the country 5. Specifically, focus on supporting farmers during the transition to organic and natural farming through technical and financial support (including ensuring quality and cost- effective organic and bio inputs)
Recommendations Recommendations 6. A targeted, ambitious and well-funded nationwide programme developed to drive the change towards organic and natural farming (It must also establish strong drivers such as a vibrant market that benefits farmers while addressing existing barriers) 7. Promotion of organic fertilizers and biofertilizers instead of chemical fertilizers (Including necessary measures to adequately produce and make available quality organic fertilizers and biofertilizers at low cost should be the priority. This includes coordinated action to promote and make city compost available as an organic fertilizer along with locally produced organic inputs) 8. Agriculture extension system to be enabled to lead and support the transition on the ground (Including mainstreaming of organic and natural farming in agriculture education and research systems) 9. Organic certification process should be improved to make it farmer-friendly and low cost 10. States should step up their action in a concerted way to promote organic and natural farming
For information, contact: For information, contact: Amit Amit Khurana Khurana Director Sustainable Food Systems Programme, CSE k_amit@cseindia.org Abhay Abhay Kumar Programme Manager Sustainable Food Systems Programme, CSE abhaykumar.singh@cseindia.org Kumar Singh Singh Abdul Halim Abdul Halim Deputy Programme Manager Sustainable Food Systems Programme, CSE abdul.halim@cseindia.org
