Challenges and Opportunities in European Railway Sector
Railway sector in Europe faces challenges such as declining demand, aging infrastructure, low efficiency, and overdependence on state support. Despite significant investments, there is a need to address issues like poor operating performance and high labor costs. Key performance indicators show variations in productivity and cost across different countries. Operating subsidy trends indicate a diminishing trend affecting the efficiency of the railway system. The passenger transport sector shows increasing unit subsidies with little incentive for efficiency improvements. Overall, the sector requires strategic reforms to enhance performance and sustainability.
Download Presentation

Please find below an Image/Link to download the presentation.
The content on the website is provided AS IS for your information and personal use only. It may not be sold, licensed, or shared on other websites without obtaining consent from the author.If you encounter any issues during the download, it is possible that the publisher has removed the file from their server.
You are allowed to download the files provided on this website for personal or commercial use, subject to the condition that they are used lawfully. All files are the property of their respective owners.
The content on the website is provided AS IS for your information and personal use only. It may not be sold, licensed, or shared on other websites without obtaining consent from the author.
E N D
Presentation Transcript
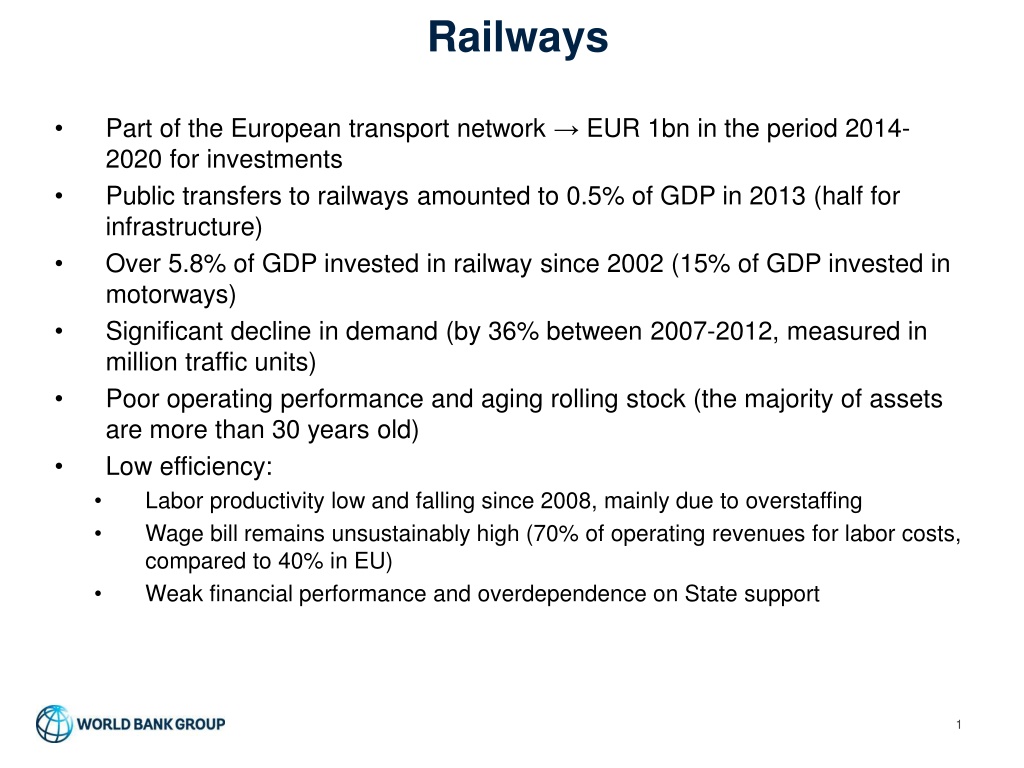
Railways Part of the European transport network EUR 1bn in the period 2014- 2020 for investments Public transfers to railways amounted to 0.5% of GDP in 2013 (half for infrastructure) Over 5.8% of GDP invested in railway since 2002 (15% of GDP invested in motorways) Significant decline in demand (by 36% between 2007-2012, measured in million traffic units) Poor operating performance and aging rolling stock (the majority of assets are more than 30 years old) Low efficiency: Labor productivity low and falling since 2008, mainly due to overstaffing Wage bill remains unsustainably high (70% of operating revenues for labor costs, compared to 40% in EU) Weak financial performance and overdependence on State support 1
Key performance indicators (2012) HZ Cargo: Wagon productivity (wagons/traffic units) 2005 2007 2009 2010 2011 2012* Traffic units (mill pass-km + ton-km) 4,372 5,482 4,706 4,474 4,249 3,525 HZ Cargo 0.38 Traffic intensity [traffic units/km] 1,603,778 2,013,924 1,728,876 1,643,644 1,560,985 1,295,004 EU-27 0.71 Total staff 14,152 13,411 12,843 12,491 12,468 11,493 Labor productivity [traffic units/staff] 308,925 408,761 366,425 358,178 340,792 306,708 Lithuania 1.56 Labor cost as % of operating revenue 76.20% 64.60% 71.20% 70.60% 78.6% 71.3% Latvia 2.68 Average depreciation [Eurocents] unit operating Cost less 0.084 0.066 0.077 0.078 0.081 0.113 Finland 0.94 Operating ratio with state support 1.25 1.27 1.12 1.12 1.04 1.33 Slovakia 0.40 Operating ratio without state support 66% 79% 72% 72% 69% 58% HZ Infrastructure: Labor productivity (staff/network) HZ Passenger Transport: Labor productivity (traffic units/staff) 5.04 HZ Passenger 100% 3.90 3.15 2.36 EU-27 462% 2.16 2.14 1.031.311.10 0.95 Finland 0.11 167% Slovakia 166% Source: HZ, State budget, World Bank calculations. 2
Operating subsidy has a diminishing trend at the expense of a non-efficient railway system 1.00 Direct contribution to railway sector as a percentage of GDP (excludes co-financing of EU funded investments and takeover of loans of railway companies) 0.90 0.80 0.70 0.60 % of GDP 0.50 0.40 0.30 0.20 0.10 0.00 2007 2008 2009 2010 2011 2012 2013 2014 (p) 2015 (f)2016 (f)2017 (f) Operating subsidy Overall budget support 127.1% 124.8% 121.6% Viability Ratio is calculated as commercial revenue to total operating costs. 115.7% 112.4% 111.5% 104.3% 97.9% Cost Recovery Ratio is calculated as total revenue, including state support, to total operating costs. 77.9% 64.9% 60.0% 59.9% 58.3% 56.7% 56.3% 54.9% *Due to separation of the railway holding in 2012, calculations from 2012 onwards are based on individual company reports 50.1% 49.9% 2005 2006 2007 2008 2009 2010 2011 2012 2013 Viability Ratio Cost Recovery Ratio Source: HZ, State budget, World Bank calculations. 3
HZ Passenger Transport: increasing unit subsidy gives no incentive to improve efficiency and optimize rail services 2010 19 1660 348 18.49 0.21 2011 18 1486 360 19.88 0.24 2012 18 1103 351 19.31 0.32 2013 14 858 355 24.85 0.41 2014 15 949 505 32.86 0.53 2015 15 971 505 34.38 0.52 2016 15 1004 505 33.84 0.50 2017 15 1038 500 32.90 0.48 2018 15 1073 495 32.02 0.46 2019 16 1097 485 31.04 0.44 train-km (mil) pax-km (mil) subsidy (HRK mil) subsidy/tkm subsidy/pkm pkm/tkm 88 82 61 60 62 66 67 68 69 70 20 40.00 1800 0.60 1600 0.50 1400 1200 0.40 15 30.00 1000 0.30 800 600 0.20 10 20.00 400 0.10 200 0 0.00 2010201120122013201420152016201720182019 5 10.00 2010 2011 2012 2013 2014 2015 2016 2017 2018 2019 pax-km (mil) subsidy/pkm train-km (mil) subsidy/tkm Source: HZP Restructuring Program, State budget, World Bank calculations. 4
HZ Infrastructure: significant delays in EU funds absorption and reliance on expensive commercial loans HZI investments during 2007-2012 (as % of GDP) EU Funds available during 2014-2020 (ESIF and CEF, in EUR) 0.70% CF Railways (TEN-T Core) 340,000,000 0.60% CF Other Railways 50,000,000 CF Mobile rail assets 90,205,755 0.50% CEF Croatia transport 456,000,000 0.40% 0.30% State budget allocation to HZI (in HRK million) 3,000.0 0.20% 2,500.0 0.10% 2,000.0 0.00% 1,500.0 2007 2008 2009 2010 2011 2012 1,000.0 EU Funds Shares of Republic of Croatia in EU Funds Modernization and Construction of Railways Infrastructure Budget funds for rail infrastructure and traffic regulation Maintenance 500.0 - 2014 2015 2016 (f) 2017 (f) Maintenance of railway infrastructure Provision from fuel tax for HZ Infrastructure OP Transport OP Competitiveness and Cohesion, PA 7 Source: HZI, State budget, MRDEUF 5
Debt service schedule of HZP and HZI HZ Passenger Transport 350.00 300.00 250.00 HRK million 200.00 150.00 100.00 50.00 - 2013 2014 2015 2016 2017 2018 2019 2020 2021 2022 2023 2024 2025 2026 2027 2028 2029 2030 2031 Repayment of principal Interest due at the end of the year Total debt service HZ Infrastructure 900.00 800.00 700.00 600.00 HRK million 500.00 400.00 300.00 200.00 100.00 - 2013 2014 2015 2016 2017 2018 2019 2020 2021 2022 2023 2024 2025 2026 2027 2028 Repayment of principal Interest due at the end of the year Total debt service Source: HZI,HZP, World Bank calculations 6
Debt servicing of railway companies is generally assumed by the State 2013-2031 4,566.19 2,662.24 1,653.99 1,264.58 6,233.02 3,253.15 HZ Infrastructure & HZ Passenger Transport (HRK millions) HZP and HZI debt servicing schedule Repayment of principal 1,200.00 of which State assumed 1,000.00 Interest due at the end of the year of which State assumed 800.00 HRK million Total debt service 600.00 of which State assumed 400.00 2013-2031 2,421.12 1,163.95 3,597.91 HZ Passenger Transport (HRK millions) 200.00 Repayment of principal - Interest due at the end of the year Total debt service Total debt service (HZI+HZP) Total debt service, state assumed (HZI+HZP) 2013-2031 2,145.07 490.04 2,635.11 HZ Infrastructure (HRK millions) Repayment of principal Interest due at the end of the year Total debt service Source: HZI,HZP, World Bank calculations 7
Main recommendations Operating subsidies need to be optimized and balanced with capital investment. They should be used as a tool to enforce efficiency in the system. Define an affordable level of funding for the sector, along with an overall transport investment program with clearer definition of financing sources and of allocations. Capital investments should be limited to EU-funded projects and critical rehabilitation of the network for the time being. Set the structure of the financial support to railways through PSC and MAIC, which are based on more thorough and reliable information. Adjust the level of services and the network size. Strengthen the contractual relationships of the infrastructure manager and passenger operator. Enforce the companies restructuring program to meet planned cost cutting targets and allow for lower subsidies. 8
Recommendations for spending review Cost analysis in railways companies Staffing Access charge to railway track (for operators) Impact of the restructuring plan (productivity investment, retrenchment) Comparison of productivity ratios Third party services (external services in subsidiaries) Work on the structure of the contracts (PSC, MAIC) Definition of services based on existing cost/revenue of the lines Definition of performance incentives based on condition, quality and productivity Think through the emergency investment needs Balance between operations and investment subsidies 9
