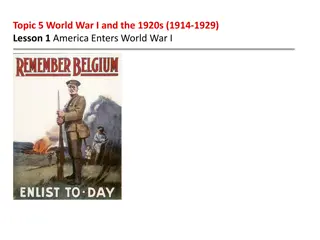
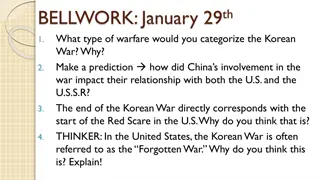
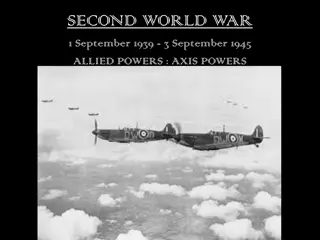
Causes of World War I and the Major Players
The push towards World War I was fueled by the MAIN causes - Militarism, Alliances, Imperialism, and Nationalism. The assassination of Archduke Franz Ferdinand in Sarajevo triggered a chain of events that led to the war. Militarism glorified military strength, alliances were formed for collective security, imperialism created rivalries for colonies, and nationalism fueled strong loyalty and ethnic tensions. The Allied Powers and Central Powers were the major factions involved in the conflict.

Download Presentation

Please find below an Image/Link to download the presentation.
The content on the website is provided AS IS for your information and personal use only. It may not be sold, licensed, or shared on other websites without obtaining consent from the author.If you encounter any issues during the download, it is possible that the publisher has removed the file from their server.
You are allowed to download the files provided on this website for personal or commercial use, subject to the condition that they are used lawfully. All files are the property of their respective owners.
The content on the website is provided AS IS for your information and personal use only. It may not be sold, licensed, or shared on other websites without obtaining consent from the author.
E N D
Presentation Transcript
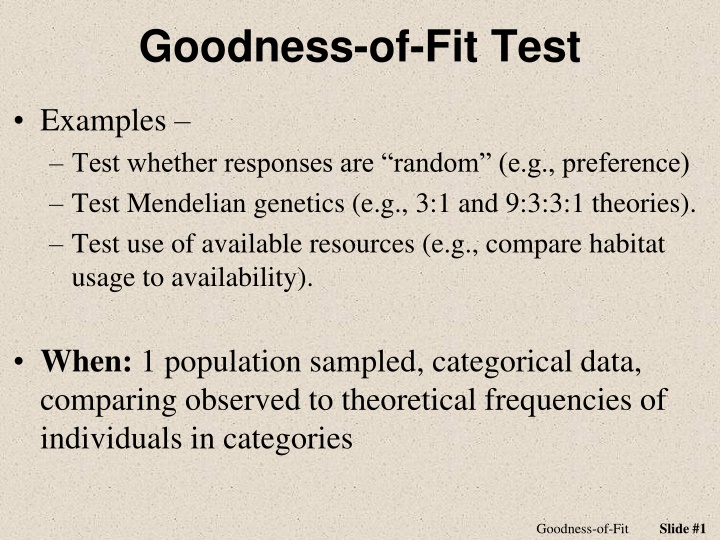
Goodness-of-Fit Test Examples Test whether responses are random (e.g., preference) Test Mendelian genetics (e.g., 3:1 and 9:3:3:1 theories). Test use of available resources (e.g., compare habitat usage to availability). When: 1 population sampled, categorical data, comparing observed to theoretical frequencies of individuals in categories Slide #1 Goodness-of-Fit
Goodness-of-Fit Test Ho: distribution of individuals into levels follows the theoretical distribution HA: distribution of individuals into levels does NOT follow the theoretical distribution Assume: at least 5 in each cell of expected table Statistic: Observed frequency table ( ) 2 ected observed exp ected table = Test Statistic: 2 exp df: cells-1 Slide #2 Goodness-of-Fit
An Illustrative Example A sample of Northland College students were played representative audio samples of The Chris Duarte Group (CDG), Ronnie Baker Brooks (RBB), and Bernard Allison (BA). Each student was asked to identify which artist they most preferred. Of the students sampled, 24, 38, and 18 preferred CDG, RBB, and BA, respectively. Determine, at the 10% level, if Northland students showed a clear preference for any of these artists. Slide #3 Goodness-of-Fit
Recipe for any Hypothesis Test 1) State the rejection criterion ( ) =0.10 2) State the null & alternative hypotheses, define the parameter(s) Ho: no preference same frequency for each artist Ha: some preference different frequency for at least one artist 3) Determine which test to perform Explain! GOF test because (a) a single population (Northland students), (b) categorical variable (artist preferred), and (c) comparing observed frequencies to theoretical uniform distribution. Slide #4 Goodness-of-Fit
Recipe for any Hypothesis Test 4) Collect the data (address type of study and randomization) (i) Observational study (no control imparted on subjects) (ii) Not clear that a random sample (n=80) was taken 5) Check all necessary assumption(s) Expected Table Artist Freq CDG 80/3=26.7 80/3=26.7 80/3=26.7 RBB BA Expected frequencies (below) are all > 5 6) Calculate the appropriate statistic(s) Observed Table Artist Freq CDG 24 RBB 38 BA 18 Slide #5 Goodness-of-Fit
Recipe for any Hypothesis Test 7) Calculate the appropriate test statistic Artist Freq Table Observed CDG 24 RBB 38 BA 18 Expected Table Artist Freq CDG 26.7 RBB 26.7 BA 26.7 ( ) ( ) ( ) 2 2 2 26 26 24 26 7 . 38 26 7 . 18 26 7 . + + 2 = 7 . 7 . 26 7 . 2 = 0.27 + 4.78 + 2.83 = 7.88 df = (3-1) = 2 Slide #6 Goodness-of-Fit
Recipe for any Hypothesis Test 8) Calculate the p-value > ( distrib(7.88,distrib="chisq",df=2,lower.tail=FALSE) ) [1] 0.01944821 9) State your rejection decision p-value (0.0194) < (0.10) . Reject Ho 10) Summarize your findings in terms of the problem Northland students appear to show a preference among the three artists. Specifically, more students preferred RBB and less preferred BA than would be expected if there had been no preference. Slide #7 Goodness-of-Fit