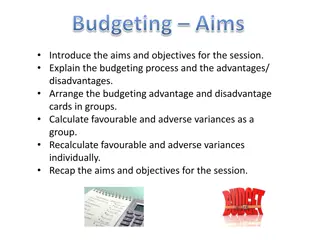
Budgeting for Success in Health Centers
This session discusses grant budgeting, operations budgeting, monitoring financial conditions, and developing management reports for health center managers. It emphasizes the importance of accurate budgeting and financial tools in decision-making processes.

Download Presentation

Please find below an Image/Link to download the presentation.
The content on the website is provided AS IS for your information and personal use only. It may not be sold, licensed, or shared on other websites without obtaining consent from the author.If you encounter any issues during the download, it is possible that the publisher has removed the file from their server.
You are allowed to download the files provided on this website for personal or commercial use, subject to the condition that they are used lawfully. All files are the property of their respective owners.
The content on the website is provided AS IS for your information and personal use only. It may not be sold, licensed, or shared on other websites without obtaining consent from the author.
E N D
Presentation Transcript
Mississippi Primary Health Care Association February 17, 2010 Holmes Community College Budgeting for Success in Health Centers Michael Holton, Manager, RSM McGladrey, Michael.Holton@rsmi.com RSM McGladrey Inc. is a member firm of RSM International an affiliation of separate and independent legal entities.
Session Goals This session is designed to help health center managers gain an understanding of the types of reports and financial tools necessary for management and Board of Director decision-making. To achieve this goal the following reporting guidelines will be discussed: 1. 330 Grant budgeting 2. Operations budgeting 3. Monitoring health center financial condition 4. Developing management reports and monitoring key indicators Slide 2
Grant Budgeting The budget is the culmination of negotiations among health center managers, clinicians, and board members as they determine the level and scope of services to be provided within the constraints of the center s resources. As part of the center s operating plan, the budget must accurately project both resources available and expenditures required to achieve the center s goals and objectives in the upcoming budget period. The budget should be based on both prior experience and expected upcoming internal and external changes in revenue sources or payment methodologies (e.g., capitation payments under Medicaid managed care). The health center s operating budget must be approved by the board; it should also be reviewed throughout the year and adjusted, as necessary, by the center s management and the board. Source: BPHC Policy Information Notice 98-23 Slide 3
TOTAL BUDGET CONCEPT HEALTH CENTER SINGLE BRHC GRANTEE Grant Budget (Scope of Project) Other State and Local Contracts & Grants Patient Revenue Federal Grant Dollars = Program Income Slide 4
TOTAL BUDGET CONCEPT HEALTH CENTER MULTIPLE BPHC GRANTEE Operating Budget (Scope of Project) Single Grant Application Section 330(e) Operations Section 330(h) Operations Patient Revenue = Program Income Other Other State and Local Contracts & Grants State and Local Contracts & Grants Patient Revenue = Program Income Other Patient Revenue = Program Income Federal Grant Dollars State and Local Contracts & Grants Federal Grant Dollars Federal Grant Dollars Ryan White Title III b Operations Slide 5
Budgeting Issues Preparation of Budget(s): 330 grant applications must submit a balanced budget (Revenues = Expenses) Grant Year Change in Scope (PIN 2002-07 demonstrate financially viable operation Operational budget = Surplus ? Fiscal Year Slide 6
330 Grant Applications Existing grantees may not request a change in their scope of project through the service area competition and non- competing continuation application. Application is only for current scope of project by an existing grantee in the defined service area. (See PIN 2002-07 for scope change requests) Existing grantees may propose in service area competition a multi year project period not to exceed 5 years New grantees may request up to a 3 year project period when applying for a service area competition against existing grantee. Note: As of 2008 grant applications and could change in the future. Please refer to most recent guidance available. Slide 7
330 Grant Applications Budget presentation should include the following forms: BPHC funding request summary (Not required for SAC) PHS 5161-1: Form SF 424A, Sections A-F Section C Non Federal Resources and Section D - Forecasted Cash Needs are not applicable Detailed budget justification (line item and narrative) for each 12-month period requested for federal funding Proposed staff profile for 12 month period requested Income analysis format for 12 month period requested Slide 8
330 Grant Applications Keys to writing line item to budget: Justification Amounts Should Agree to Budget Forms Be Specific Regarding Each Line of the Budget (Revenue and Expenses - See example in PIN): If Variable Costs, Describe Calculation of Cost (e.g., Supplies Cost Per Visit X Visit) If Fixed Cost, Describe Cost (e.g., Rent As Per Lease Agreement) Note: As of 2008 grant applications and could change in the future. Please refer to most recent guidance available. Slide 9
330 Grant Applications Budget Narrative Additional information and detail may be provided in narrative form, as needed. Cost effectiveness (Cost/Visit, Cost/User, Grant $ per user) Users Visits If a capital managed care program is included, the applicant should: describe each current capitated managed care arrangement, identifying the services for which the applicant is at risk; provide the current number of enrollees and support for the projected number of enrollees included in the total user count In addition, if there are budget items for which costs are shared with other programs (e.g. HRSA programs or an independent home health program administered by the applicant organization), the basis for the allocation of costs between federally supported programs and other independent programs must be explained. Slide 10
330 Grant Applications And Budgeting Budgets for Year 2, 3, 4 and 5 Continue to budget conservatively Consider any contractual agreements (Union Contacts) for impact on salaries and fringe benefits If organization has a strategic plan it should be factored into budget No change in scope can be factored into 330 grant application budgets Consider new contracts being received in the near future Consider cost of living adjustments or inflationary factors on expenses Any variances greater than 5% should be explained Slide 11
330 Grant Applications Make Certain the Budget Balances!!!!! Review Patient Revenue Factors Review Staffing BE CONSERVATIVE WHEN PROJECTING PATIENT SERVICES REVENUE!!!! (If overly aggressive projection are used, an unobligated balance (UOB - ) of Federal funds instead of Estimated Program Income (EPI - ) could result when the Financial Status Report (FSR) is filed) Slide 12
330 Grant Applications SUPPORT REQUESTED NAP (10 points) 1. Applicant demonstrates that the budget presentation (an annualized budget for each 12 month period for which funding is requested of the new project period) is appropriate and reasonable in terms of: a. The level of requested Federal grant funds versus total budget for each year; b. The total resources required to achieve the goals and objectives of the applicant s proposed service delivery plan (i.e., total project budget); c. The maximization of non-grant revenue relative to the proposed plan and other Federal/State/local/in-kind resources applied to the project; d. The projected patient income is reasonable based on the patient mix and number of projected users and encounters; e. The number of proposed users and encounters; f. The total cost per user and encounter; g. The total federal section 330 grant dollars per user. Slide 13
330 Grant Applications SUPPORT REQUESTED NAP (continued) 2. Applicant demonstrates that the Federal grant funds requested are being used to leverage other sources of funding 3. Applicant demonstrates that the business plan goals and objectives are targeted and demonstrate appropriate financial planning in the development of the proposal and for the long-term success of the project 4. Applicant describes how the proposed health center is a cost- effective approach to meeting the primary care needs of the target population given the health care needs of the target population and the level of health care resources currently available in the community Note: As of 2008 NAP grant applications and could change in the future. Please refer to most recent guidance available. Slide 14
330 Grant Applications SUPPORT REQUESTED SAC (10 POINTS) 1. Applicant provides a complete and clear budget presentation (SF- 424A, budget justification, Form 2: Staffing Profile, and Form 3: Income Analysis) and describes: a) How the total budget is aligned and consistent with the applicant s proposed service delivery plan and number of patients to be served. b) How reimbursement is or will be maximized from third party- payors (e.g. Medicare, Medicaid, SCHIP, private insurance, etc.) given the patient mix and number of projected patients and encounters. c) How the proportion of requested Federal grant funds is appropriate given other sources of income discussed in (b) and specified in Form 3: Income Analysis Slide 15
330 Grant Budgeting Budgeting of Expenditures Salaries Fringe benefits Supplies Rent Interest Other = = = = = = Staffing Plan (FTEs) Percent of Salaries and Wages Based on Visits Based on Current Leases Based on Current Loan Payments Based on Reasonable/justifiable methodology (sq/ft, visits, FTE, etc.) Slide 16
330 Grant Budgeting Staffing Budget: Consider: Current Payroll Register New Program or Site Expansion Need Salary Cost and FTE Detail Provider Versus Non-Provider Staff Staffing Assists in the Budgeting of Various Expenses and Visits Slide 17
330 Grant Budgeting Expenditures: Review Prior Year Audited Financial Statements Review First 6 Months Internal Financial Statement Base Expenditures on First 6 Months Financial Statement: Compare to Prior Year for Major Differences Reconcile Increase or Decrease Appropriate Cost Due to Visit Volume Variance Increase or Decrease Due to Unit Cost Differences Slide 18
330 Grant Budgeting Patient Revenue Projection 1. # Visits = # of Providers (FTEs) X Indicator or Projected Visits (Indicators: Providers = 4,200 Visits/Year; Mid-levels = 2,100) 2. Payor Mix % 3. Current Approved Rates (MCD, MCR, Capitation - PMPM and Specialty Care Visits) 4. Sliding Scale & Contractual Adjustment 5. Collection % (Bad Debt Expense) Slide 19
330 Grant Budgeting Calculation of Projected Visits Employee Dr. S. Smith Dr. M. Sanchez Internist Bill Jones Total Visits Projected Budgeted FTE Visits 1.00 4,000 1.00 4,000 Nurse Prac. 1.00 Position Internist Visits 4,000 4,000 2,500 10,500 2,500 Slide 20
330 Grant Budgeting % 20 20 15 35 10 # Visits 2,100 2,100 1,575 3,675 1,050 10,500 Rate $60 *** $75 Var Var Coll. % 95% 100% 100% 50% 50% Revenues $119,700 105,592 118,440 27,563 26,250 $397,545 Payor MCD MC. Cap# MCR S/P* OTP** 100% # Managed Care Capitation Revenue * Average collection $7.50 ***Based on projected member months and capitation rate ** Average collection $25.00 Slide 21
330 Grant Budget Summary DHHS Grant Program Income Contract Services Interest Income Other Total Revenue $ 494,426 (1) 397,545 237,195 (2) 4,180 (2) 8,644 (2) $1,141,990 Total Projected Expenses Excess of Projected Expenses Over Projected Revenue $ 0*** *** CHCs must always submit a balanced budget when submitting a 330 grant application. $1,141,990 Slide 22
330 Grant Applications Other Key Points / Coordination Needed With Other Sections of Grant Application: Run Budget as a Check of Compliance with Financial Performance Measures Business and Healthcare Plan Improvement Proposal (Goals & Objectives) Address Findings and Issues (Audit & Performance Reviews) Slide 23
Operational Budgeting Development Slide 24
Importance of Budgeting Preparation of an annual operational budget and continuous budget monitoring allows management to anticipate and prepare for the effects of change from year to year. Projecting an operational budget begins with the determination of assumptions (internal and external) and a review of historical visit volume, expenses, and revenue. Monitoring the operational budget monthly will ensure the organization is apprised of the actual financial situation of the organization as well as allow adjustments in expectations and planning based on actual numbers. Slide 25
Operational and Programmatic Budgeting In addition to retrospective reporting of financial and statistical data, CHCs should prospectively develop operational budgets to assist in the management of health center service delivery. There are various approaches to building an operational budget: Zero-Based Budgets Top-Down Budgets Incremental Budgets Deciding which approach works best for your organization depends on management style, current financial and strategic position, available resources, etc. Slide 26
Operational and Programmatic Budgeting Zero-Based Budgeting - budgets are built from the unit level up. Each unit of revenue (visits, rates, grants) and cost (FTEs, salaries, fringe, and OTPS line items) are created based on expected performance. Advantages: Forces careful consideration of all items Allows health center to measure the impact of specific items Allows for decision-making at the lowest level Disadvantages: Individual parts may not tie together as a whole Time-consuming Slide 27
Operational and Programmatic Budgeting Top-Down Budgeting - budgets are built from the highest level down (total revenue, total expense). Goals for the entire health center are applied to total revenue and expenses, and individual components (sites, programs) adjust their budgets accordingly. Advantages: Takes into account big picture Allows management to have large budget influence Measures realism of health center goals Disadvantages: May ignore specific, important unit level issues Slide 28
Operational and Programmatic Budgeting Incremental Budgeting - prior year amounts are trended based on expected performance. Advantages: Incorporates historical perspective with expected trends Easy to create budget quickly Disadvantages: Trending from full-year vs. point in time (i.e., FTE that started in the middle of the year) Slide 29
Operational and Programmatic Budgeting Under all three budget development options, CHCs can develop budgets for each department/program of the health center and/or budget by site. The following are some of the reasons to prepare budgets in one form or another: Department (i.e., Pediatrics) - allows management to understand the yearly changes of visit volume and costs by department and allows a focus on productivity at the individual provider level. Delivery Site - provides focus on health center operations and visit volume by a group. By creating a profit and loss statement by site, management can identify where additional resources are needed. Slide 30
Budget Preparation Timeline Overall organization budget preparation for the next year should begin four months prior to the health center s current year end. For 330 budgets, health centers need to consider appropriate preparation timeline. 330 grant budgets are due four months prior to the beginning of a grant period. Slide 31
Sample Budget Preparation Timeline Timeline Leading to Approved Budget Action 4 months - Executive Management Meeting with Department Managers and Site Managers 3 months - Budget template distributed to Department Managers - Budget preparation training - Equipment request lists prepared 2 months - Department budgets due to Finance Department - Provider production, salaries, fringe benefits, and contractual revenue entered by Finance Department Slide 32
Sample Budget Preparation Timeline Timeline Leading to Approved Budget Action 6 weeks - Finance team reviews department budgets - Begin dialogue with Board Finance Committee - Departmental budgets returned to Department Managers for revisions - Meetings set with Finance Department - Revised budgets due from Department Managers 4 weeks 2 weeks 1-2 weeks Directors Meeting and for final approval by Board of Directors - Finance team finalizes budget for Board of Slide 33
Department Head Responsibility Preparing Budget: Review prior year s budget and actual expenditures Identify capital and equipment needs Provide written explanation for budget changes (increases or decreases of more than 10%) from prior year Provide crosswalk between performance goals and budget requests During Budget Period: Provide written explanation for variance between actual amounts and budgeted amounts during the fiscal year Ensure proper coding of invoices Slide 34
Finance Department Responsibility Preparing Budget: Prepare visit volume projections Estimate staffing changes for coming year Review projected revenue, compare against current contracts and reimbursement rates Review program-specific spending patterns Develop recommendations for program-specific spending authority Review capital and equipment needs submitted by department heads Slide 35
Finance Department Responsibility During Budget Period: Generate actual versus budget reports for each department head monthly Review with department head if necessary Prepare monthly financial package by site for management and the Board Adjust for any unforeseen regulatory changes in a program s budgeted reimbursement Slide 36
Steps To Preparing An Organizational Budget Slide 37
Importance of Budgeting Preparation of an annual budget and continuous budget monitoring allows management to anticipate and prepare for the effects of change from year to year. Projecting a budget begins with the determination of assumptions (internal and external) and a review of historical visit volume, expenses, and revenue. Monitoring the budget monthly will ensure the organization is apprised of the actual financial situation of the organization as well as allow adjustments in expectations and planning based on actual numbers. Re-budgeting is not recommended as a strategy during the year, but that significant variances of actual experience be explained from the original budget. Slide 38
Step One: Identify All Sites and All Programs by Site It is recommended that a health center prepare a budget by building from the program/department up. Health Center Site Department Program Slide 39
Step One: Identify All Sites and All Programs by Site Site A Site B Site C Primary Care Dental WIC Primary Care Primary Care Pediatrics Geriatrics HIV (counseling services non-billable) Slide 40
Step Two: Prepare A Projected Visit Report Because revenue and expenses are projected from visit assumptions the first step is to develop an organization-wide staffing list by site, department and program which includes FTEs, job title and funding source. Sources to Use: Provider FTE Detail - Payroll Slide 41
Step Two: Prepare A Projected Visit Report ABC Health Center - Budgeted Visit Report Total Budgeted Visits 1,721 4,056 2,500 3,935 4,202 3,815 4,200 2,059 2,364 2,628 31,480 Medical FTE 0.4 1.0 1.0 1.0 1.0 1.0 1.0 1.0 1.0 1.0 9.4 Average Visits 4,302 4,056 2,500 3,935 4,202 3,815 4,200 2,059 2,364 2,628 Employee Dr. S. Smith Dr. B. Scott Dr. P. Lee Dr. H. Grafton Dr. A. Rosen Dr. L. Hanks Dr. J. Diaz Ann Ramondo Leslie Arnold Rosa Ferraro Total Position Site A 1,721 Site B Site C Internist/Medical Dir. Pediatrics Dentist Internist Internist Geriatrics Internist Nurse Practitioner Nurse Practitioner Nurse Practitioner 4,056 2,500 3,935 2,101 2,101 3,815 4,200 2,059 2,364 2,628 12,600 10,480 8,400 Slide 42
Step Two: Prepare A Projected Visit Report There are various factors to consider when projecting visit volume. The following are a few examples: User trends (demand side) Payor mix (demand side) New sites and/or departmental expansion = new hires (supply side) Provider productivity targets (supply side) Slide 43
Step Two: Prepare A Projected Visit Report User Trends: (What are the trends?) Is the health center increasing the number of users due to outreach? Is it losing users to competitors? Are there any changes in the community that may cause current users to increase/decrease their number of visits? Has there been a change in community demographics that may cause a variation in the user profile, (i.e., more families moving into the community, less migrant workers due to economy)? Has managed care changed utilization rates (up or down)? Do certain payors have different use rates than others? Slide 44
Step Two: Prepare A Projected Visit Report Payor Mix: Changes in economy resulting in changes in payor mix Implementation of Medicaid Managed Care, Child Health Programs, Family Health Programs Age of community Changes in policy, (i.e., welfare reform, State programs - uncompensated care) Slide 45
Step Two: Prepare A Projected Visit Report New Sites and/or Services: Opening/Closing of a site Consider whether a new site will shift visits from an existing site. Adding new services/departments Slide 46
Step Two: Prepare A Projected Visit Report Productivity: Review prior year productivity levels by provider. What factors may contribute to a change in provider productivity? Has the health center actively taken steps to increase productivity (i.e., implemented compensation plan, educational training, individual provider productivity reporting)? Are there new providers who are building their panel? Are exam rooms and support staff at capacity? Is productivity driven by supply (internal) or demand (external) issues? an incentive Slide 47
Step Two: Prepare A Projected Visit Report Productivity: Set productivity projections: Consensus between Medical Director and providers on realistic productivity projection If the health center is planning a major expansion, is there demand in the community to meet visit targets? Recognize the role of contracted providers is the data available to impute FTEs (may also be useful for provider dependent expenses) Consider folding in providers who only spend a portion of their time doing visits with other providers Slide 48
Step Three: Revenue Projection Revenue Budgeting Fee for Service/Cost-Based Reimbursement: In the visit projection for ABC Health Center, the physicians at Site A performed 7,980 visits and the dentist performed 2,500 visits. To calculate revenue for Site A, the steps are to: 1. Divide up visits by payor mix 2. Multiple visits by charge per visit 3. For all payors except self-pay and capitation, compare charge per visit to net revenue per visit to calculate contractual allowance rate and calculate net revenue. 4. For self-pay, multiply charge by average sliding fee percentage. 5. Multiply by collection percentage to calculate projected revenue. Slide 49
Step Three: Revenue Projection Revenue Budgeting - Capitation: In projecting capitation rates for commercial plans a standard trend factor could be applied based on historical rate increases. In projecting capitation rates for State programs, such as Medicaid Managed Care, Child Health Program and Family Health Program, an understanding on policy legislation, and overall market trends will help accurate projections. Slide 50