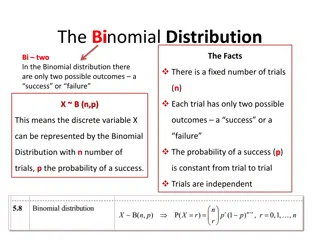
Binomial Distribution through Tree Diagrams
T
h
e
B
i
n
o
m
i
a
l
D
i
s
t
r
i
b
u
t
i
o
n
T
h
r
o
u
g
h
t
r
e
e
d
i
a
g
r
a
m
s
Expand (a+b)
2
Now let us consider the following:
We roll a fair dice and record the number of 6’s we roll
Represent this as a tree diagram
Now let us consider the following:
We roll a fair dice and record the number of 6’s we roll, and call this X
Find P(X=2)
Find P(X=1)
Find P(X=0)
Note that these will
sum to 1
Now let us consider the following:
We roll a fair dice twice and record the number of 6’s we roll, and call this X
Does this look familiar?
(a+b)
2
= a
2
+ 2 x a x b + b
2
Success 2 times
Success 1 time
Success 0 times
(a+b)
2
= a
2
+ 2 x a x b + b
2
What binomial would
this have come from?
Success 2 times
Success 1 time
Success 0 times
Success
Failure
By writing probability outcomes as
binomials we can quickly find probabilities
for higher numbers of trials, rather than
draw out huge tree diagrams
Expand (a+b)
3
Now let us consider the following:
We roll a fair dice 3 times and record the number of 6’s we roll, and call this X
Find P(X=3)
Find P(X=2)
Find P(X=1)
Success
Success
Success
Success
Failure
Failure
Failure
Failure
Find P(X=0)
(a+b)
3
= a
3
+ 3 x a
2
x b + 3 x a x b
2
+ b
3
What binomial would
this have come from?
Success 2 times
Success 1 time
Success 0 times
Success
Failure
By writing probability outcomes as
binomials we can quickly find probabilities
for higher numbers of trials, rather than
draw out huge tree diagrams
Success 3 times
Now let us consider the following:
We roll a fair dice 4 times. By expanding (a + b)
4
, find the probability of rolling exactly two 6’s.
(a + b)
4
=
a
4
+ 4 x a
3
x b + 6 x a
2
x b
2
+ 4 x a x b
3
+ b
4
Success
Failure
So….
=
Which probability represents rolling exactly two 6’s?
So P (X = 2) =
Still not convinced?
This is the last diagram, and furthest I will go with a tree diagram
Find P(X=2)
Success
Success
Success
Success
Failure
Failure
Failure
Failure
Success
Failure
Success
Failure
Success
Failure
Success
Failure
Success
Failure
Success
Failure
Success
Failure
Success
Failure
So P (X = 2)
In General if P(Success) = p, then to find P(X = a) from n trials
Success
Failure
P (X = a)
=
From the expansion where
Concept of binomial distribution using tree diagrams to represent various scenarios of rolling a fair dice multiple times and calculating probabilities. The content covers examples, calculations, and explanations to help you grasp the underlying principles easily.

Download Presentation

Please find below an Image/Link to download the presentation.
The content on the website is provided AS IS for your information and personal use only. It may not be sold, licensed, or shared on other websites without obtaining consent from the author.If you encounter any issues during the download, it is possible that the publisher has removed the file from their server.
You are allowed to download the files provided on this website for personal or commercial use, subject to the condition that they are used lawfully. All files are the property of their respective owners.
The content on the website is provided AS IS for your information and personal use only. It may not be sold, licensed, or shared on other websites without obtaining consent from the author.
E N D
Presentation Transcript
The Binomial Distribution The Binomial Distribution Through tree diagrams Through tree diagrams
Now let us consider the following: We roll a fair dice and record the number of 6 s we roll Represent this as a tree diagram
Now let us consider the following: We roll a fair dice and record the number of 6 s we roll, and call this X 2 1 6 1 6 Find P(X=2) Success + Success 1 6 Find P(X=1) 5 6 1 6 5 + Failure 6 Find P(X=0) 1 6 1 6 5 Success 6 5 6 Failure + 2 5 6 5 6 Failure 2 Note that these will sum to 1 5 6 2 2 1 6 5 1 6 + + 1 6
Now let us consider the following: We roll a fair dice twice and record the number of 6 s we roll, and call this X Success 0 times Success 1 time Success 2 times Does this look familiar? (a+b)2 = a2 + 2 x a x b + b2 2 5 6 2 2 1 6 5 1 6 + + 6
(a+b)2 = a2 + 2 x a x b + b2 2 5 6 2 2= What binomial would this have come from? 2 1 6 5 1 6 1 6+5 + + 6 6 Success 0 times Success 1 time Success 2 times 2 1 6+5 By writing probability outcomes as binomials we can quickly find probabilities for higher numbers of trials, rather than draw out huge tree diagrams 6 Success Failure
Now let us consider the following: We roll a fair dice 3 times and record the number of 6 s we roll, and call this X Find P(X=3) 3 1 6 1 6 Success 1 6 2 1 6 5 Success Failure 5 6 6 Success 1 6 2 1 6 1 6 5 Find P(X=2) Success Failure 2 Failure 6 5 6 1 6 5 6 5 6 2 1 6 1 6 1 6 5 Success Failure Success 2 6 1 6 5 6 5 6 5 6 Failure 2 1 6 1 6 5 6 Find P(X=1) Success Failure 5 6 3 5 6 5 6 Failure Find P(X=0) 2 3 3 2 1 6 5 5 6 1 6 3 1 5 6 + 3 + + 6 1 6
(a+b)3 = a3 + 3 x a2 x b + 3 x a x b2 + b3 2 2 3 3 3= 1 6 5 3 1 5 6 1 6 5 6 1 6+5 What binomial would this have come from? + 3 + 6 + 6 6 Success 3 times Success 1 time Success 0 times Success 2 times 3 1 6+5 By writing probability outcomes as binomials we can quickly find probabilities for higher numbers of trials, rather than draw out huge tree diagrams 6 Success Failure
Now let us consider the following: We roll a fair dice 4 times. By expanding (a + b)4, find the probability of rolling exactly two 6 s. a4 + 4 x a3 x b + 6 x a2 x b2 + 4 x a x b3 + b4 (a + b) 4 = So . 4 3 2 2 4 3 4 1 6+5 1 6 5 1 6 5 6 1 6 + 4 1 5 6 5 6 + 6 + 4 = + 6 6 6 Which probability represents rolling exactly two 6 s? Success Failure 2 2 1 6 5 6 So P (X = 2) = 6 =0.1157047047 = 0.116 (3SF)
Still not convinced? This is the last diagram, and furthest I will go with a tree diagram 1 6 Success 1 6 Success Find P(X=2) 5 6 Failure Success Failure Success Failure Success Failure Success Failure Success Failure 1 6 Success 1 6 Failure 5 6 2 2 1 6 5 6 Success 5 6 1 6 1 6 1 6 Success 2 2 1 6 2 5 6 2 5 6 Failure 5 6 1 6 1 6 5 6 Failure 5 6 5 6 1 6 1 6 Success 2 2 1 6 5 6 So P (X = 2) 5 6 1 6 Success 1 6 2 2 5 6 1 6 5 6 Failure 5 6 2 2 5 6 2 2 Failure 1 6 5 6 1 6 5 6 1 6 1 6 Success Failure = 6 Success 5 6 Failure 5 6 1 6 =0.1157407407 Success Failure 5 6 Failure 5 6 = 0.116 (3SF)
In General if P(Success) = p, then to find P(X = a) from n trials ? ? P (X = a) = ?? 1 ?? ? From the expansion where ? + (1 ?)? Failure Success

2")


2 = a2 + 2 x a x b")
3")

3 = a3 + 3 x a2 x b + 3 x a x")


 = p, then to find P(X = a) from n")