Bayes Classifiers Exercises and Solutions
Dive into Bayes Classifiers through a series of exercises covering Bayes Theorem and its practical applications in various scenarios like population demographics, production defects in machines, and email classification. This comprehensive guide provides detailed explanations and solutions to help enhance your understanding of Bayesian inference concepts.

Download Presentation

Please find below an Image/Link to download the presentation.
The content on the website is provided AS IS for your information and personal use only. It may not be sold, licensed, or shared on other websites without obtaining consent from the author. If you encounter any issues during the download, it is possible that the publisher has removed the file from their server.
You are allowed to download the files provided on this website for personal or commercial use, subject to the condition that they are used lawfully. All files are the property of their respective owners.
The content on the website is provided AS IS for your information and personal use only. It may not be sold, licensed, or shared on other websites without obtaining consent from the author.
E N D
Presentation Transcript
Bayes Classifiers: Exercise
Exercise 1 Bayes Theorem Guide to Intelligent Data Science Second Edition, 2020 2
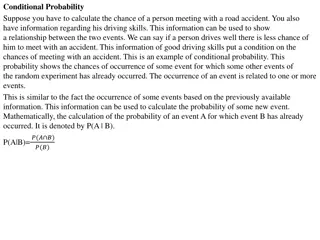
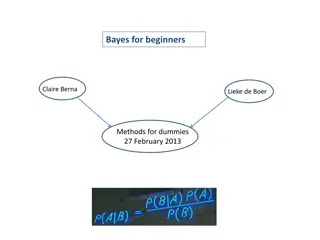
Bayes Theorem The conditional probability ? ? , hypothesis is true given event ? ? ? =? ? ?( ) ?(?) ?( ): Probability of hypothesis ?(?): Probability of event ? ? ? : Conditional probability of event ? given hypothesis Guide to Intelligent Data Science Second Edition, 2020 3
Bayes Theorem Answer the following questions and give an explanation of your answers. 1. 2.6% of the total population is color-blind. On average, 5 out of 100 men and 25 out of 10000 women are color-blind. We assume that the number of men and women in the total population is equivalent. Now we choose a color-blind person from the population, what is the probability that this person is a man? 2. In a company, machine M1 produces 20% of the total production, machine M2 produces 30% and machine M3 produces 50%. On average, 2% of the production of M1, 4% of M2 and 7% of M3 is defective. We take out one defective part of the production, what is the probability that it has been produced by M1/M2/M3? 3. Your mailbox contains 100 unread emails. 80% of these mails are spam, 20% are non-spam. 25% of spam emails and 50% of non-spam emails contain the word urgent . You open a random email and it contains the word urgent . What is the probability that this is a spam email? What is the probability that this is not a spam email? Guide to Intelligent Data Science Second Edition, 2020 4
Bayes Theorem 1. 2.6% of the total population is color-blind. On average, 5 out of 100 men and 25 out of 10000 women are color-blind. We assume that the number of men and women in the total population is equivalent. Now we choose a color-blind person from the population, what is the probability that this person is a man? Let F be the event that the person is a woman and M the event that the person is a man. B is the event that the person is color-blind. The following probabilities are given: ? ? = 0.5 ? ? = 0.5 ? ? ? = 0.05 ? ? ? = 0.0025 Inserting those values into the Bayes Theorem we get: ? ? = 0.026 ? ? ? =?(?|?) ?(?) =0.05 0.5 0.026 0.96 ?(?) Guide to Intelligent Data Science Second Edition, 2020 5
Bayes Theorem 2. In a company, machine M1 produces 20% of the total production, machine M2 produces 30% and machine M3 produces 50%. On average, 2% of the production of M1, 4% of M2 and 7% of M3 is defective. We take out one defective part of the production, what is the probability that it has been produced by M1/M2/M3? Let ??(? = 1,2,3) be the event that the part has been produced by machine ??, ? the event that the part is defective. The following probabilities are given: ? ?1 = 0.2 ? ?|?1 = 0.02 ? ?2 = 0.3 ? ?|?2 = 0.04 ? ?3 = 0.5 ? ?|?3 = 0.07 To use Bayes theorem we need to calculate the total probability for ?: ? ? = ? ? ?1 ? ?1 + ? ? ?2 ? ?2 + ? ? ?3 ? ?3 = 0.02 0.20 + 0.04 0.30 + 0.07 0.50 = 0.051 Guide to Intelligent Data Science Second Edition, 2020 6
Bayes Theorem 2. In a company, machine M1 produces 20% of the total production, machine M2 produces 30% and machine M3 produces 50%. On average, 2% of the production of M1, 4% of M2 and 7% of M3 is defective. We take out one defective part of the production, what is the probability that it has been produced by M1/M2/M3? On average 5.1% of all parts are defective. With Bayes Theorem: p1= ? ?1|? =? ?|?1?(?1) =0.02 0.20 0.051 0.078 ?(?) p2= ? ?2|? =? ?|?2?(?2) =0.04 0.30 0.051 0.235 ?(?) p3= ? ?3|? =? ?|?3?(?3) =0.07 0.50 0.051 0.686 ?(?) Guide to Intelligent Data Science Second Edition, 2020 7
Bayes Theorem 3. Your mailbox contains 100 unread emails. 80% of these mails are spam, 20% are non-spam. 25% of spam emails and 50% of non-spam emails contain the word urgent . You open a random email and it contains the word urgent . What is the probability that this is a spam email? What is the probability that this is not spam? Let ? be the event that the email is spam and ?? the event that the email is not spam. ?is the event that the email contains the word urgent . The following probabilities are given: ? ? = 0.8 ? ?? = 0.20 ? ? ? = 0.25 ? ? ?? = 0.50 To use the Bayes Theorem we need to calculate the total probability for: ? ? = ? ? ? ? ? + ? ? ?? ? ?? = 0.25 0.80 + 0.50 0.20 = 0.30 Guide to Intelligent Data Science Second Edition, 2020 8
Bayes Theorem 3. Your mailbox contains 100 unread emails. 80% of these mails are spam, 20% are non-spam. 25% of spam emails and 50% of non-spam emails contain the word urgent . You open a random email and it contains the word urgent . What is the probability that this is a spam email? What is the probability that this is not spam? With Bayes Theorem: ? ? ? =? ?|? ?(?) =0.25 0.8 0.3 2 3 = ?(?) Guide to Intelligent Data Science Second Edition, 2020 9
Exercise 2 Na ve Bayes Guide to Intelligent Data Science Second Edition, 2020 10
Nave Bayes age spec-prescrib astigmatism tear-prod-rate contact lenses young myope no reduced none young myope no normal soft young myope yes reduced none The following database for fitting contact lenses is given. Based on the attributes age, spectacle prescription, astigmatism and tear production rate the task is to predict whether a patient should be fitted with hard contact lenses, soft contact lenses or not be fitted with contact lenses at all. young myope yes normal hard young hypermetrope no reduced none young hypermetrope no normal soft young hypermetrope yes normal hard pre-presbyopic myope no reduced none pre-presbyopic myope yes normal hard pre-presbyopic hypermetrope no reduced none pre-presbyopic hypermetrope no normal soft pre-presbyopic hypermetrope yes reduced none pre-presbyopic hypermetrope yes normal none presbyopic myope no reduced none presbyopic myope no normal none presbyopic myope yes reduced none presbyopic myope yes normal hard presbyopic hypermetrope no reduced none presbyopic hypermetrope no normal soft presbyopic hypermetrope yes reduced none presbyopic hypermetrope yes normal none Guide to Intelligent Data Science Second Edition, 2020 11
Nave Bayes Compute all probabilities that are necessary to predict the following instances with a Na ve Bayes classifier and classify them age spec-prescrib astigmatism tear-prod-rate young hypermetrope yes reduced pre-presbyopic myope no normal pre-presbyopic myope yes reduced Guide to Intelligent Data Science Second Edition, 2020 12
Nave Bayes The conditional probability tables for all attributes: Class hard none soft Count 4 13 4 pre- Class/astig. no yes Class/age presbyopic young presbyopic hard 0 4 hard 1 1 2 none 7 6 none 4 6 3 soft 4 0 soft 1 1 2 Class/tear- prod-rate Class/spec- prescrip hypermetr ope normal reduced myope hard 4 0 hard 3 1 none 3 10 none 7 6 soft 4 0 soft 3 1 Guide to Intelligent Data Science Second Edition, 2020 13
Nave Bayes age spec-prescrib astigmatism tear-prod-rate young hypermetrope yes reduced hard ? ??? ? ????? ??? ? ??????????? ??? ? ??? ??? ? ??????? ??? = 0 none ? ???? ? ????? ???? P hypermetrope none ? ??? ???? 13 21 3 7 13 10 6 ? ??????? ???? = 13 13 13> 0 soft ? ???? ? ????? ???? ? ??????????? ???? ? ??? ???? ? ??????? ???? = 0 ????= ???? Guide to Intelligent Data Science Second Edition, 2020 14
Nave Bayes age spec-prescrib astigmatism tear-prod-rate pre-presbyopic myope no normal hard ? ??? ? ??? ?????????? ??? ? ????? ??? ? ?? ??? ? ?????? ??? = 0 none ? ???? ? ??? ?????????? ???? P ????? none ? ?? ???? 13 21 soft ? ???? ? ??? ?????????? ???? ? ????? ???? ? ?? ???? 4 21 1 4 6 7 3 ? ?????? ???? = 13 13 13 13 0.011 4 1 4 4 4 4 ? ?????? ???? = 4 0.012 ????= ???? Guide to Intelligent Data Science Second Edition, 2020 15
Nave Bayes age spec-prescrib astigmatism tear-prod-rate pre-presbyopic myope yes reduced hard ? ??? ? ??? ?????????? ??? ? ????? ??? ? ??? ??? ? ??????? ??? = 0 none ? ???? ? ??? ?????????? ???? P ????? none ? ??? ???? 13 21 soft ? ???? ? ??? ?????????? ???? ? ????? ???? ? ??? ???? ? ??????? ???? = 0 4 6 13 10 6 ? ??????? ???? = 13 13 13 0.011 ????= ???? Guide to Intelligent Data Science Second Edition, 2020 16
Thank you For any questions please contact: education@knime.com Guide to Intelligent Data Science Second Edition, 2020 17