Atlantic Overturning Observed and Simulated Variability
Exploring the initiation of the Atlantic overturning using observations and simulation reconstructions with models. Analysis of historical agreement, synchronisation, and control simulations. Investigation of a 20-year cycle in sea ice cover, feedback mechanisms, and the impact of events like the Mt. Agung eruption. Discussion on the realism of models and the need for additional evidence, including AMOC responses post-eruption. Comparison with CMIP5 multi-model results and in situ salinity data. Insights from last millennium data and a proposed conceptual model to explain AMOC variability.

Download Presentation

Please find below an Image/Link to download the presentation.
The content on the website is provided AS IS for your information and personal use only. It may not be sold, licensed, or shared on other websites without obtaining consent from the author.If you encounter any issues during the download, it is possible that the publisher has removed the file from their server.
You are allowed to download the files provided on this website for personal or commercial use, subject to the condition that they are used lawfully. All files are the property of their respective owners.
The content on the website is provided AS IS for your information and personal use only. It may not be sold, licensed, or shared on other websites without obtaining consent from the author.
E N D
Presentation Transcript
Initialisation of the Atlantic overturning Obs. (Huck et Reconstructions IPSLCM5A-LR simulations nudged or free (with observed external forcings) Nudged with SST Two reconstructions of the Atlantic overturning (AMOC) 15 yrs Historical Agreement between nudged and reconstructions Synchronisation also in the historical simulations Control Swingedouw et al., Clim. Dyn. 2013 1963
20-yr cycle in IPSL-CM5A-LR Sea ice cover -, SLP- negative delayed feeedback EGC + 10 yrs 3yrs 5yrs convection + T, S + 2yrs 9yrs 60oW 0o AMOC + Escudier et al. Clim. Dyn. 2013 30oW
20-yr cycle in IPSL-CM5A-LR Sea ice cover -, SLP- negative delayed feeedback EGC + 10 yrs 3yrs 5yrs convection + T, S + 2yrs Mt Agung eruption 9yrs 60oW 0o AMOC + Escudier et al. Clim. Dyn. 2013 30oW
Is it real? Model dependent? (Zanchettin et al. 2012) Need for other lines of evidences (observations!) AMOC response around 15 years after the eruption is the key assumption that needs to be tested!
CMIP5 multi-model confirmation? Ensemble mean of 8 models from CMIP5 with peak variability in the frequency band 10-30 yrs Resembles IPSLCM5A ensemble mean of 5 members (r=0.97) Not the case for the others who have a larger spread and mainly shows a decreasing trend in their ensemble mean
Comparison with in situ salinity data Labrador data available from Canadian Bedford Institute of Oceanography Reconstruction of SSS variability over the east subpolar gyre (Reverdin 2010) Agreement between historical and data (20-yr sliding window correlation, p<0.1) An explanation for two GSAs!
Last millennium perspective We select the same timeseries following volcanoes in data and SST in the North Atlantic from the model Significant correlation both in model and data, following AMOC variations by around 5 years
A conceptual model to explain AMOC variability in the model We propose a conceptual model based on: harmonic response to volcanoes Linear response to radiative forcing (GHG) -t-ti D 3 aiH(t-ti)sin(2p f(t)= t) e 20 i=1
AMOC response in the IPSL-CM5A-LR model -t-ti D-b RF(t) 3 aiH(t-ti)sin(2p f(t)= t) e 20 i=1 -t-ti D-b RF(t) 2 aiH(t-ti)sin(2p f(t)= t) e 20 i=1 +c NAO(t+T) Robson et al. 2014
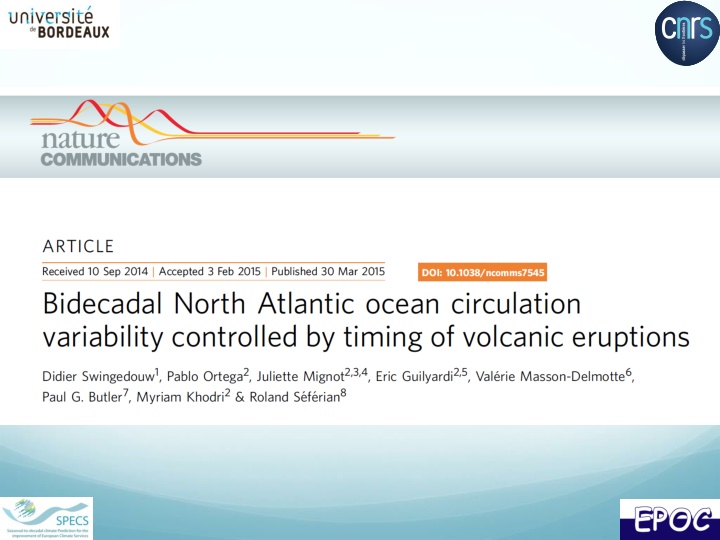
Impact of volcanoes on the NAO Pinatubo has been followed by postive NAO, and this could be due to dynamical adjustment in the atmosphere (Robock et al. 1992, Ottera et al. 2008) Confirmed over the last millennium by Ortega et al. (Nature 2015)
Full effect of volcanoes on the AMOC Volcanoes also impact NAO and therefore the AMOC! We can include such an effect in our conceptual model.
Conclusions Volcanic eruption precedes an AMOC maximum by around 10-15 years in IPSLCM5A-LR model Impact of volcanoes also very clear in a 9-member CMIP5 ensemble, BUT exact mechanism unclear (cf. Menary et al. 2015) Consistent with in situ salinity data in the subpolar gyre And data of Greenland and Iceland over the last millennium large body of evidence supporting the validity of the mechanism in the real world Effect of Pinatubo: destructive interference! Decadal predictability in case of eruption in the future Multi-model ensemble from SPECS models to test this: Pinatubo in 2015 (need for 20-30 yrs hindcasts then in progress using IPSL model)
Thank you! Didier.Swingedouw@u-bordeaux1.fr Courtesy of Bruno Ferron, OVIDE 2010
Greenland data 20-yr preferential variability EOF1 of a compilation of 6 ice cores reconstructing Greenland 18O over the last millennium (Ortega et al. 2014) PC1 18O ice cores EOF1 18O ice cores B18 NGRIP GISP2 GRIP Crete DYE-3
Link Greenland-AMO Greenland as high-resolution proxy of North Atlatic SST (AMO)? AMOC leads AMO in the model by 5-10 years
A paleo-indicator of the subpolar AMOC? Butler et al. (2013): bivalve as a very high temporal resolution proxy Not SST, rather related to nutrient supply Butler et al. 2013 Pseudo-proxy approach: is there a link between nutrient and AMOC in the model north of Iceland? AMOC leads nutrient supply north of Iceland by 1-3 years
Implication for recent variability Climatic index Agung 15 yrs Model free Time 1963 1982 1991 2006
Implication for recent variability Climatic index El Chichon Agung 15 yrs Time 1963 1982 1991 2006
Implication for recent variability Destructive interference? Climatic index El Chichon Pinatubo Agung 15 yrs Time 1963 1982 1991 2006
Removing Pinatubo within IPSL-CM5A-LR model Historical No Pinatubo The sensitivity ensemble without Pinatubo shows a larger decrease in the early 2000s as compared to historical ensemble Then a partial recovery in the late 2010s
Background t2m skill without trends: years 2-5 AMOC: a key player for decadal prediction Volcanic impact on AMOC (Ottera et al. 2011, Iwi et al. 2010, Mignot et al. 2011 ) Bi-decadal variability in the North Atlantic: in several models (Frankcombe et al. 2010 ) and in data (Chylek et al. 2011, Sicre et al. 2008, Divine & Dick 2006 ) Van Oldenborgh et al. 2012 Zanchettin et al. 2012
Experimental design IPSL-CM5A-LR climate model O 5-member historical ensemble (natural and anthropogenic forcing) 5-member initialised ensemble nudged with SST anomalies 5-member sensitivity ensemble without Pinatubo CMIP5 ensemble Comparison with existing in situ SSS data Paleo-climate support Pinatubo Agung El Chichon
Comparison of the AMOC forcings NAO forcing is larger than that from volcanoes Over the period 1973-2018: Std volcanoes =0.54 Sv Std NAO = 0.93 Sv
Scaling of the conceptual model We use a cost function based on MSE between IPSL model and toy model
Mechanisms Historical No Pinatubo HadISST Pinatubo decreases SST and increases sea-ice cover in the GIN Seas This interferes with variability of the EGC This removes the salinity anomalies in the Labrador Sea And then the convection and the AMOC variations
GSA GSA GSA In situ Labrador Sea variation The 1985 GSA is clearly different from 1972 and 1993 in the sense that there is a subsurface positive anomaly Belkin et al. (1998): two modes of GSA, one remote (Artic) and one more local (1980s) Central Labrador Sea from 1949 to 2005 (updated from Yashayaev et al., 2003) Source IPCC 2007
Temperature propagation
Comparison model-proxies Pseudo-proxy approach: is there a link between nutrient and AMOC in the model? AMOC leads nutirent supply with 1-3 years