Assessing WRF EMS for Texas Heavy Rainfall Event

U
s
i
n
g
t
h
e
S
P
o
R
T
M
E
T
S
c
r
i
p
t
s
t
o
A
s
s
e
s
s
t
h
e
W
R
F
E
M
S
f
o
r
a
S
o
u
t
h
e
a
s
t
T
e
x
a
s
H
e
a
v
y
R
a
i
n
f
a
l
l
E
v
e
n
t
P
a
t
r
i
c
k
B
l
o
o
d
a
n
d
L
a
n
c
e
W
o
o
d

1
9
Z
SPoRT Model Simulation Matrix
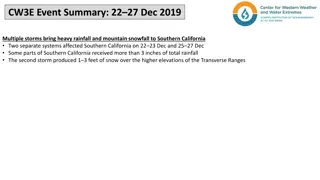
Cold Season Heavy Rainfall - WFO Houston Case Study
November 8-9, 2011
Andrew Molthan
Variability in Storm Total Precipitation – All Points, All Hours
We learned that selecting the appropriate PBL and Microphysics is important
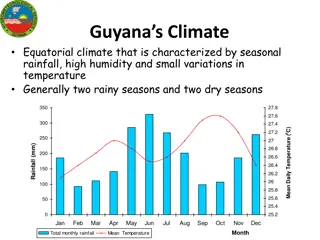
18 April 2009 Synoptic Overview
•
Upper divergence apparent at 300 mb level with SE
Texas between two diverging jet streaks.
•
500 mb low moving over the southern plains with a
shortwave trough moving across SE Texas.
•
Deep layer moisture in the lower levels noticed at the
850 and 700 mb levels (PWATS : ~1.55” (
25
th
percentile)
).
•
Pre-existing surface trough over the Houston area with
a dry line and cold front approaching from the west.
18 April 2009 Synoptic Overview
courtesy of http://www.spc.noaa.gov/obswx/maps/
12 UTC 18 April 2009 00 UTC 19 April 2009
3
0
0
m
b
18 April 2009 Synoptic Overview
courtesy of http://www.spc.noaa.gov/obswx/maps/
12 UTC 18 April 2009 00 UTC 19 April 2009
5
0
0
m
b
12 UTC 18 April 2009 00 UTC 19 April 2009
18 April 2009 Synoptic Overview
courtesy of http://www.spc.noaa.gov/obswx/maps/
8
5
0
m
b
18 April 2009 Synoptic Overview
courtesy of http://www.hpc.ncep.noaa.gov/html/sfc_archive.shtml
12 UTC 18 Apr 2009 15 UTC 18 Apr 2009 18 UTC 19 Apr 2009
Surface plot/fronts/pressure
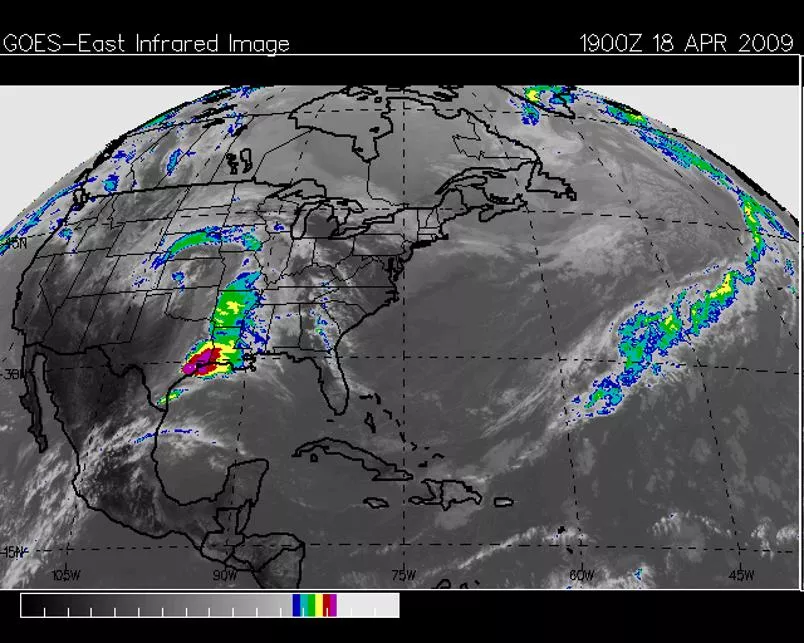
T
h
e
A
p
r
i
l
1
8
t
h
2
0
0
9
E
x
t
r
e
m
e
R
a
i
n
E
v
e
n
t
Inland trough provided the convergence / ample inflow (1014.3 mb at IAH)
1
8
Z
S
u
r
f
a
c
e
A
n
a
l
y
s
i
s
L
L
L
L
M
M
e
e
s
s
o
o
-
-
L
L
o
o
w
w
f
f
o
o
r
r
m
m
s
s
a
a
n
n
d
d
e
e
n
n
h
h
a
a
n
n
c
c
e
e
s
s
i
i
n
n
f
f
l
l
o
o
w
w
1
8
2
9
Z
1
9
0
2
Z
1
9
3
0
Z
1
9
5
6
Z
2
4
H
o
u
r
P
r
e
c
i
p
i
t
a
t
i
o
n
E
s
t
i
m
a
t
e
f
r
o
m
K
H
G
X
R
R
a
a
i
i
n
n
f
f
a
a
l
l
l
l
R
R
a
a
t
t
e
e
C
C
o
o
m
m
p
p
a
a
r
r
i
i
s
s
o
o
n
n
s
s
/
/
I
I
m
m
p
p
a
a
c
c
t
t
s
s
T
T
h
h
e
e
1
1
8
8
A
A
p
p
r
r
i
i
l
l
e
e
v
v
e
e
n
n
t
t
h
h
a
a
d
d
9
9
.
.
9
9
o
o
f
f
i
i
t
t
s
s
1
1
1
1
i
i
n
n
c
c
h
h
m
m
a
a
x
x
o
o
f
f
r
r
a
a
i
i
n
n
f
f
a
a
l
l
l
l
f
f
a
a
l
l
l
l
i
i
n
n
6
6
h
h
o
o
u
u
r
r
s
s
w
w
i
i
t
t
h
h
6
6
.
.
9
9
i
i
n
n
c
c
h
h
e
e
s
s
i
i
n
n
o
o
n
n
e
e
h
h
o
o
u
u
r
r
.
.
T
h
e
A
p
r
i
l
1
8
t
h
2
0
0
9
E
x
t
r
e
m
e
R
a
i
n
E
v
e
n
t
I
I
m
m
a
a
g
g
e
e
C
C
o
o
u
u
r
r
t
t
e
e
s
s
y
y
:
:
G
G
a
a
l
l
v
v
e
e
s
s
t
t
o
o
n
n
D
D
a
a
i
i
l
l
y
y
N
N
e
e
w
w
s
s
T
T
h
h
e
e
S
S
t
t
r
r
a
a
n
n
d
d
I
I
m
m
a
a
g
g
e
e
C
C
o
o
u
u
r
r
t
t
e
e
s
s
y
y
:
:
G
G
a
a
l
l
v
v
e
e
s
s
t
t
o
o
n
n
D
D
a
a
i
i
l
l
y
y
N
N
e
e
w
w
s
s
H
H
i
i
s
s
t
t
o
o
r
r
i
i
c
c
a
a
l
l
W
W
R
R
F
F
E
E
M
M
S
S
R
R
u
u
n
n
s
s
a
a
n
n
d
d
A
A
s
s
s
s
e
e
s
s
s
s
i
i
n
n
g
g
w
w
i
i
t
t
h
h
t
t
h
h
e
e
M
M
o
o
d
d
e
e
l
l
E
E
v
v
a
a
l
l
u
u
a
a
t
t
i
i
o
o
n
n
T
T
o
o
o
o
l
l
s
s
(
(
M
M
E
E
T
T
)
)
Forecaster Patrick Blood has utilized 3 different model
initialization datasets, 6 PBLs, and 8 microphysical schemes
to produce 144 model runs to analyze - using v3.4 of the
WRF EMS.
Using the SPoRT MET scripts v4.1 and the new grib2
capability (courtesy of Brad Zavodsky) to objectively assess
the precipitation forecasts.
This work is part of Mr. Blood’s MS Thesis work at the
University of Houston. He is in the early stages of data
analysis.
24 km x 24 km
Re-Analysis
Initialization:
C : CFSR
PBL Schemes:
1: Yonsei
4: QNSE
Microphysical
Schemes:
02: Lin
06: WSM 6 Class
08: Thompson
09: Milbrandt-Yau
10: Morrison
13: Stony Brook
University
14: WDM 5-Class
16: WDM 6-Class
24 km x 24 km
Re-Analysis
Initialization:
C : CFSR
PBL Schemes:
1: Yonsei
4: QNSE
Microphysical
Schemes:
02: Lin
06: WSM 6 Class
08: Thompson
09: Milbrandt-Yau
10: Morrison
13: Stony Brook
University
14: WDM 5-Class
16: WDM 6-Class
24 km x 24 km
Re-Analysis Initialization:
C : CFSR
PBL Schemes:
1: Yonsei
4: QNSE
Microphysical Schemes:
02: Lin
06: WSM 6 Class
08: Thompson
09: Milbrandt-Yau
10: Morrison
13: Stony Brook University
14: WDM 5-Class
16: WDM 6-Class
24 km x 24 km
Re-Analysis
Initialization:
C : CFSR
PBL Schemes:
1: Yonsei
4: QNSE
Microphysical
Schemes:
02: Lin
06: WSM 6 Class
08: Thompson
09: Milbrandt-Yau
10: Morrison
13: Stony Brook
University
14: WDM 5-Class
16: WDM 6-Class
24 km x 24 km
Re-Analysis
Initialization:
C : CFSR
PBL Schemes:
1: Yonsei
4: QNSE
Microphysical
Schemes:
02: Lin
06: WSM 6 Class
08: Thompson
09: Milbrandt-Yau
10: Morrison
13: Stony Brook
University
14: WDM 5-Class
16: WDM 6-Class
24 km x 24 km
Re-Analysis Initialization:
C : CFSR
PBL Schemes:
1: Yonsei
4: QNSE
Microphysical Schemes:
02: Lin
06: WSM 6 Class
08: Thompson
09: Milbrandt-Yau
10: Morrison
13: Stony Brook University
14: WDM 5-Class
16: WDM 6-Class
Stage III Precipitation
Stage III Precipitation
21-22 Z
22-23 Z
23-24 Z
Example of 6
consecutive 1
hour precip.
totals from a
WRF-EMS run
During the
critical
afternoon
period
PBL: BouLac
Microphysics:
WDM 5-class
mm
18-19 Z
19-20 Z
20-21 Z
21-22 Z
22-23 Z
23-24 Z
> 3 inches
Re-Analysis Initialization:
C : CFSR
PBL Schemes:
1: Yonsei
4: QNSE
Microphysical Schemes:
02: Lin
06: WSM 6 Class
08: Thompson
09: Milbrandt-Yau
10: Morrison
13: Stony Brook University
14: WDM 5-Class
16: WDM 6-Class
24 km x 24 km
Re-Analysis Initialization:
C : CFSR
PBL Schemes:
1: Yonsei
4: QNSE
Microphysical Schemes:
02: Lin
06: WSM 6 Class
08: Thompson
09: Milbrandt-Yau
10: Morrison
13: Stony Brook University
14: WDM 5-Class
16: WDM 6-Class
24 km x 24 km
Re-Analysis Initialization:
C : CFSR
PBL Schemes:
1: Yonsei
4: QNSE
Microphysical Schemes:
02: Lin
06: WSM 6 Class
08: Thompson
09: Milbrandt-Yau
10: Morrison
13: Stony Brook University
14: WDM 5-Class
16: WDM 6-Class
24 km x 24 km
E
E
a
a
r
r
l
l
y
y
O
O
b
b
s
s
e
e
r
r
v
v
a
a
t
t
i
i
o
o
n
n
s
s
The strongest performers across the three PBLs/spatial-temporal
schemes were the Lin, Thompson, WRF Single Moment (WSM) 6
class, and both WRF Double Moment (WDM) 5 and 6 classes.
There was a trend to over-forecast 1 inch rainfall amounts (Frequency
Bias) in the last couple of hours (Yonsei, QNSE) and under-forecast
during the early-mid afternoon heavy rainfall period.
The BouLac-WDM 5 class simulation performed well. It placed a 2 to 3
inch bulls-eye over central and southern Galveston County (22 - 24Z) a
couple of hours behind where 2 to 3 inches were sensed by the radar
(20 – 22Z).
Acknowledgements: Brad Zavodsky, Jon Case, Jayanthi Srikishen
Using the SPoRT MET Scripts, researchers analyzed the WRF EMS for a heavy rainfall event in Southeast Texas. The study emphasized the importance of selecting appropriate PBL and Microphysics settings for accurate assessment. Various synoptic overviews and weather data from April 18th, 2009 were used to understand the atmospheric conditions contributing to the extreme rain event. The study provides insights into the variability in storm total precipitation and the factors influencing heavy rainfall in the region.

Download Presentation

Please find below an Image/Link to download the presentation.
The content on the website is provided AS IS for your information and personal use only. It may not be sold, licensed, or shared on other websites without obtaining consent from the author.If you encounter any issues during the download, it is possible that the publisher has removed the file from their server.
You are allowed to download the files provided on this website for personal or commercial use, subject to the condition that they are used lawfully. All files are the property of their respective owners.
The content on the website is provided AS IS for your information and personal use only. It may not be sold, licensed, or shared on other websites without obtaining consent from the author.
E N D
Presentation Transcript
Using the SPoRT MET Scripts to Assess the WRF EMS for a Southeast Texas Heavy Rainfall Event Patrick Blood and Lance Wood 19 Z
SPoRT Model Simulation Matrix Cold Season Heavy Rainfall - WFO Houston Case Study November 8-9, 2011 Andrew Molthan
Variability in Storm Total Precipitation All Points, All Hours We learned that selecting the appropriate PBL and Microphysics is important
18 April 2009 Synoptic Overview Upper divergence apparent at 300 mb level with SE Texas between two diverging jet streaks. 500 mb low moving over the southern plains with a shortwave trough moving across SE Texas. Deep layer moisture in the lower levels noticed at the 850 and 700 mb levels (PWATS : ~1.55 (25th percentile)). Pre-existing surface trough over the Houston area with a dry line and cold front approaching from the west.
18 April 2009 Synoptic Overview courtesy of http://www.spc.noaa.gov/obswx/maps/ 12 UTC 18 April 2009 00 UTC 19 April 2009 300 mb
18 April 2009 Synoptic Overview courtesy of http://www.spc.noaa.gov/obswx/maps/ 12 UTC 18 April 2009 00 UTC 19 April 2009 500 mb
18 April 2009 Synoptic Overview courtesy of http://www.spc.noaa.gov/obswx/maps/ 12 UTC 18 April 2009 00 UTC 19 April 2009 850 mb
18 April 2009 Synoptic Overview courtesy of http://www.hpc.ncep.noaa.gov/html/sfc_archive.shtml 12 UTC 18 Apr 2009 15 UTC 18 Apr 2009 18 UTC 19 Apr 2009 Surface plot/fronts/pressure
The April 18th 2009 Extreme Rain Event 18Z Surface Analysis Inland trough provided the convergence / ample inflow (1014.3 mb at IAH)
Meso-Low forms and enhances inflow L L L L 1829Z 1902Z L L L L 1930Z 1956Z
24 Hour Precipitation Estimate from KHGX
Rainfall Rate Comparisons / Impacts Return Period: 10year 25year 50year 100year 500year The 18 April event had 9.9 of its 11 inch max of rainfall fall in 6 hours with 6.9 inches in one hour.
The April 18th 2009 Extreme Rain Event Friendswood The Strand Image Courtesy: Galveston Daily News Image Courtesy: Galveston Daily News
Historical WRF EMS Runs and Assessing with the Model Evaluation Tools (MET) Forecaster Patrick Blood has utilized 3 different model initialization datasets, 6 PBLs, and 8 microphysical schemes to produce 144 model runs to analyze - using v3.4 of the WRF EMS. Using the SPoRT MET scripts v4.1 and the new grib2 capability (courtesy of Brad Zavodsky) to objectively assess the precipitation forecasts. This work is part of Mr. Blood s MS Thesis work at the University of Houston. He is in the early stages of data analysis.
Re-Analysis Initialization: 24 km x 24 km C : CFSR PBL Schemes: 1: Yonsei 4: QNSE Microphysical Schemes: 02: Lin 06: WSM 6 Class 08: Thompson 09: Milbrandt-Yau 10: Morrison 13: Stony Brook University 14: WDM 5-Class 16: WDM 6-Class
Re-Analysis Initialization: 24 km x 24 km C : CFSR PBL Schemes: 1: Yonsei 4: QNSE Microphysical Schemes: 02: Lin 06: WSM 6 Class 08: Thompson 09: Milbrandt-Yau 10: Morrison 13: Stony Brook University 14: WDM 5-Class 16: WDM 6-Class
Re-Analysis Initialization: 24 km x 24 km C : CFSR PBL Schemes: 1: Yonsei 4: QNSE Microphysical Schemes: 02: Lin 06: WSM 6 Class 08: Thompson 09: Milbrandt-Yau 10: Morrison 13: Stony Brook University 14: WDM 5-Class 16: WDM 6-Class
Re-Analysis Initialization: 24 km x 24 km C : CFSR PBL Schemes: 1: Yonsei 4: QNSE Microphysical Schemes: 02: Lin 06: WSM 6 Class 08: Thompson 09: Milbrandt-Yau 10: Morrison 13: Stony Brook University 14: WDM 5-Class 16: WDM 6-Class
Re-Analysis Initialization: C : CFSR 24 km x 24 km PBL Schemes: 1: Yonsei 4: QNSE Microphysical Schemes: 02: Lin 06: WSM 6 Class 08: Thompson 09: Milbrandt-Yau 10: Morrison 13: Stony Brook University 14: WDM 5-Class 16: WDM 6-Class
24 km x 24 km Re-Analysis Initialization: C : CFSR PBL Schemes: 1: Yonsei 4: QNSE Microphysical Schemes: 02: Lin 06: WSM 6 Class 08: Thompson 09: Milbrandt-Yau 10: Morrison 13: Stony Brook University 14: WDM 5-Class 16: WDM 6-Class
18-19 Z 21-22 Z Stage III Precipitation 19-20 Z 22-23 Z 20-21 Z 23-24 Z
18-19 Z Example of 6 consecutive 1 hour precip. totals from a WRF-EMS run During the critical afternoon period PBL: BouLac Microphysics: WDM 5-class 21-22 Z 19-20 Z 22-23 Z 20-21 Z > 3 inches 23-24 Z mm
Re-Analysis Initialization: C : CFSR 24 km x 24 km PBL Schemes: 1: Yonsei 4: QNSE Microphysical Schemes: 02: Lin 06: WSM 6 Class 08: Thompson 09: Milbrandt-Yau 10: Morrison 13: Stony Brook University 14: WDM 5-Class 16: WDM 6-Class
Re-Analysis Initialization: C : CFSR 24 km x 24 km PBL Schemes: 1: Yonsei 4: QNSE Microphysical Schemes: 02: Lin 06: WSM 6 Class 08: Thompson 09: Milbrandt-Yau 10: Morrison 13: Stony Brook University 14: WDM 5-Class 16: WDM 6-Class
Re-Analysis Initialization: C : CFSR 24 km x 24 km PBL Schemes: 1: Yonsei 4: QNSE Microphysical Schemes: 02: Lin 06: WSM 6 Class 08: Thompson 09: Milbrandt-Yau 10: Morrison 13: Stony Brook University 14: WDM 5-Class 16: WDM 6-Class
Early Observations The strongest performers across the three PBLs/spatial-temporal schemes were the Lin, Thompson, WRF Single Moment (WSM) 6 class, and both WRF Double Moment (WDM) 5 and 6 classes. There was a trend to over-forecast 1 inch rainfall amounts (Frequency Bias) in the last couple of hours (Yonsei, QNSE) and under-forecast during the early-mid afternoon heavy rainfall period. The BouLac-WDM 5 class simulation performed well. It placed a 2 to 3 inch bulls-eye over central and southern Galveston County (22 - 24Z) a couple of hours behind where 2 to 3 inches were sensed by the radar (20 22Z). Acknowledgements: Brad Zavodsky, Jon Case, Jayanthi Srikishen