Assessing Energy Savings Strategies in Public Buildings
The Belgian demo project in Liège aims to achieve a significant reduction in energy consumption through control strategy optimization. By analyzing indoor air temperature distribution and annual energy demand, the BRICKER Project seeks to transform existing public buildings into highly energy-efficient, zero-emission facilities. The study evaluates the impact of different heating systems and control strategies on energy savings and indoor comfort levels.
Download Presentation

Please find below an Image/Link to download the presentation.
The content on the website is provided AS IS for your information and personal use only. It may not be sold, licensed, or shared on other websites without obtaining consent from the author.If you encounter any issues during the download, it is possible that the publisher has removed the file from their server.
You are allowed to download the files provided on this website for personal or commercial use, subject to the condition that they are used lawfully. All files are the property of their respective owners.
The content on the website is provided AS IS for your information and personal use only. It may not be sold, licensed, or shared on other websites without obtaining consent from the author.
E N D
Presentation Transcript
ENERGY REDUCTION IN PUBLIC BUILDING STOCK: ASSESSING THE IMPACT OF CONTROL STRATEGY OVER EXPECTED ENERGY SAVINGS AND INDOOR COMFORT LEVEL Ruiz, Roberto D Antoni, Matteo Lemort, Vincent
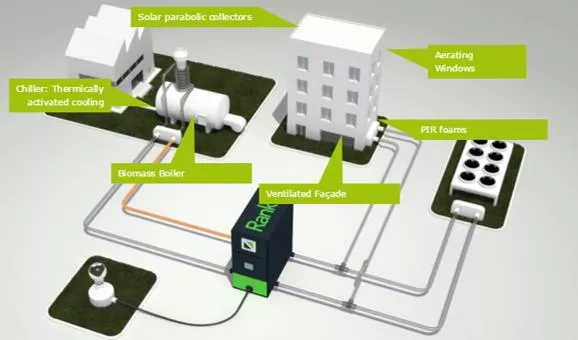
Tuesday, September 10, 2024 CLIMA Conference 2016 Introduction 1. The actual control strategy implemented in the Belgian demo of Bricker project is: introduced, compared against an ideal approach and accordingly optimized. 2. The optimized approach is tested by means of numerical simulations over a base case scenario. 3. Indoor air temperature distribution and annual specific energy demand over a specific zone are used as main performance indicators. The BRICKER Project aims to develop a scalable, replicable, high energy efficient, zero emissions and cost effective system to refurbish existing public-owned non-residential buildings to achieve at least 50% energy consumption reduction. See more at: http://www.bricker-project.com 2
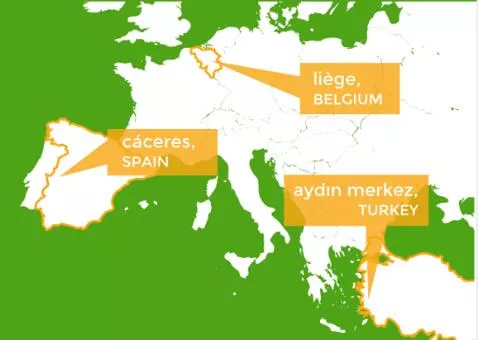
Tuesday, September 10, 2024 CLIMA Conference 2016 Building Demo Main characteristics School building demo located in Li ge (Belgium). It counts with 22,300 m2 of usable area. Poor quality of building assemblies Gas-fuel boilers High-temperature heating terminals. Surface area distribution per space type Building configuration 3
Tuesday, September 10, 2024 CLIMA Conference 2016 Existing Heating System 10 Space heating circuits (8 radiators 2 AHUs) 1 Conditioned ventilation circuit (AHUs) Secondary System Distribution + Emission Gas boiler 1 2300 kW Heat exchanger 7500 kW Heating header Return side Gas boiler 2 2300 kW Heating header Supply side Gas boiler 3 2900 kW Primary System Generation + Heat exchanger 3 natural gas boilers =7.5 [MW] PI controller Valve opening (manipulated variable) Supply temperature (controlled variable) e(t) Setpoint Temperature (From heating curve) 3-way valve + PI (controller) - Feedback signal 4
Tuesday, September 10, 2024 CLIMA Conference 2016 Actual control strategy ??,??= ??,??+ ?????+ ????+ ???? Supply water setpoint temperature: ? = ?.??? ? Heating curve (transmission losses): ??, ?= ????,??+ ? ????,?? ???? ? = ?.??? Infiltration losses correction: ?????= ??? 0.1 ?????,5.4 Solar gains correction: ????= ??? 0.01 ??, 5 Indoor temperature deviation: ?? = ?.?? ????,??,???= ????,??+ ?? (????,?? ???? ????= ??, ?????,??,??? ??, ?????,?? 5
Tuesday, September 10, 2024 CLIMA Conference 2016 Ideal approach: Radiator s heating curve 2) Over-temperature between radiator & environment 1) Radiator emitted power 3) Water temperature difference ? ? ?? ? =??,??+ ??,?? ????= ????,? ??= ??,?? ??,?? ???? ? ????= ????,?? Required water supply temperature ? ? ???? ????,? ??+? ???? ????,? ????,? ???? ??,??= ????,??+ ? ??,? Energy balance for a thermal zone ????= ??????+ ???? ???? ???? ????,?? ???? ????,? ????,? Design parameters ??????= ???+ ??????? ?? ??,? ???? 6
Tuesday, September 10, 2024 CLIMA Conference 2016 Proposed Approach One water setpoint temperature and one correction according to the actual state of the indoor temperature. ??,??= ??,??+ ?????+ ????+ ???? ? 1) Water supply temperature ??, ?= ????,??+ ? ????,?? ???? New parameters k and are determined from a regression procedure carried out after evaluating the theoretical heating curve by replacing: ????= ???+ ????= (?? + ????) ????,?? ???? Solar gain correction can be added by calculating an equivalent indoor temperature setpoint ???? ????,??,??= ????,?? ?? + ???? 7
Tuesday, September 10, 2024 CLIMA Conference 2016 2 ) Indoor temperature deviation correction ????,??,????= ????,??,??+ ?? ????,?? ??? Only transmission losses in heating curve Transmission and infiltration losses in heating curve ?? =?? + ???? ?? + ???? ?? =?? + ???? = 1 ?? ????= ??, ?????,??,???? ??, ?????,??,?? 8
Tuesday, September 10, 2024 CLIMA Conference 2016 Testing proposed approach Load to cover by installed radiator Thermal zone characteristics 60 Parameter ????? ??? ?????,??? ??????? ??? ?? ???? Value 446 2,048 153 174 0.6 1.237 0.4158 Unit m2 m3 m2 m2 1/h kW/K kW/K 40 Qrad [kW] 20 Qrad=UA*(20-Tout) Qrad=UA*(20-Tout) Qrad=(UA+Hinf)*(20-Tout) Qrad=(UA+Hinf)*(20-Tout) 0 -15 -10 -5 0 Tout [C] 5 10 15 20 80 Installed radiator characteristics Parameter ????,? ? ????,? ?? ??,? ??,??,? Value 53.8 Unit kW 60 Tw,hc [C] 1.3 3,465 48.3 13.3 75 - kg/h K K C 40 Tw,hc (QUA) Tw,hc (QUA) Tw,hc (QUA+Qinf) Tw,hc (QUA+Qinf) Tw,hc = 20+4.272*(20-Tout)0.742 Tw,hc = 20+4.272*(20-Tout)0.742 20 -15 -10 -5 0 Tout [C] 5 10 15 20 Required water supply temperature to cover a certain load 9
Tuesday, September 10, 2024 CLIMA Conference 2016 Scenario 1: actual approach. Scenario 2: actual approach without any correction (solar or infiltration). Scenario 3: proposed approach considering only transmission losses at steady state. Scenario 4: proposed approach considering transmission and infiltration losses. Scenario 5: same as scenario 4 integrating correction by solar gains in function of incident radiation. Control parameters for different scenarios ? ? ?? 1.05 1.05 1.33 1.00 1.00 Scenario 1 2 3 4 5 4.272 4.272 2.766 3.466 3.466 0.742 0.742 0.792 0.793 0.793 Solar gain correction 10
Tuesday, September 10, 2024 CLIMA Conference 2016 Simulation Results Box-and-whisker plot of resulting indoor temperature when heating power is needed. Data divided into setpoint hours (left) and setback hours (right). Erad Scenario % Diff kWh/m2-y 181.4 185.8 157.9 178.5 167.7 Maximum 1 2 3 4 5 - 95th percentile 2.4% -13.0% -1.6% -7.6% 75th percentile Median / Setpoint (black dot) 25th percentile 5th percentile Minimum 11
Tuesday, September 10, 2024 CLIMA Conference 2016 Conclusions Actual control strategy implemented in the Belgian demo of BRICKER project was presented, compared against an ideal approach, improved and tested by means of numerical simulation. 5 different scenarios were assessed resulting scenario 3 the most optimal in terms of indoor temperature and specific heating energy demand. For BRICKER project purposes, the main conclusion of this work is the demonstration that control strategy of energy generation and distribution systems has to be revised whenever deep renovation of passive or active building technologies is undertaken. Contrarily to which, project renovation goals cannot be met. 12
Tuesday, September 10, 2024 CLIMA Conference 2016 Roberto Ruiz r.ruiz@ulg.ac.be http://www.labothap.ulg.ac.be 13
