Analyzing Flood Risk Pattern Changes in Canada Under Climate Shift
The study delves into the evolving flood risk patterns across Canada amidst a changing climate scenario. By employing advanced models and methodologies, the research aims to project future flood occurrences and assess the associated risks. Through meticulous data collection and analysis, the team is scrutinizing the impact on flood frequency and magnitude under different climate projections. The study's progress encompasses literature review, model validation, flood risk analysis, and future flow projections, contributing significant insights into the evolving flood dynamics in Canada.
Uploaded on Oct 10, 2024 | 2 Views
Download Presentation

Please find below an Image/Link to download the presentation.
The content on the website is provided AS IS for your information and personal use only. It may not be sold, licensed, or shared on other websites without obtaining consent from the author.If you encounter any issues during the download, it is possible that the publisher has removed the file from their server.
You are allowed to download the files provided on this website for personal or commercial use, subject to the condition that they are used lawfully. All files are the property of their respective owners.
The content on the website is provided AS IS for your information and personal use only. It may not be sold, licensed, or shared on other websites without obtaining consent from the author.
E N D
Presentation Transcript
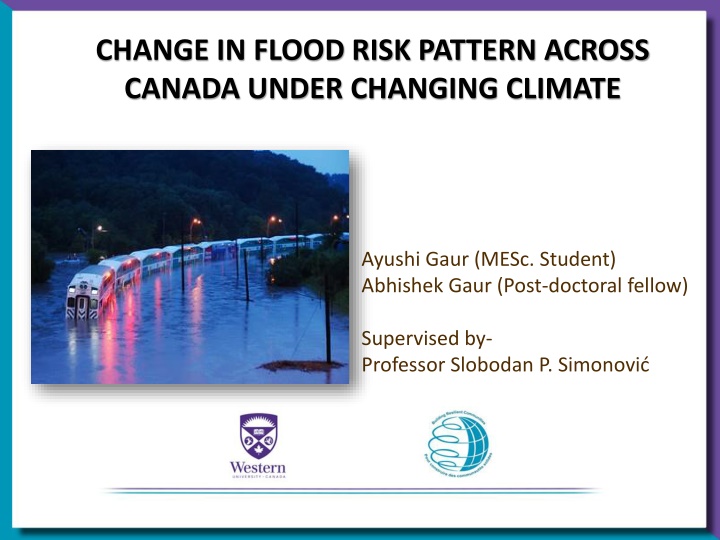
CHANGE IN FLOOD RISK PATTERN ACROSS CANADA UNDER CHANGING CLIMATE Ayushi Gaur (MESc. Student) Abhishek Gaur (Post-doctoral fellow) Supervised by- Professor Slobodan P. Simonovi
2| Work progress ResearchObjective To analyze changes in flow risk patterns across Canada under changing climate scenario. Work completed Literature Review Model selection Data collection CamaFlood model validation CamaFlood model performance across Canada Future flow projection for CanESM2, RCP4.5 Flood frequency analysis (100 year and 250 year) Change in Flood Risk across Canada under Changing Climate Ayushi Gaur, Abhishek Gaur, Professor Slobodan P. Simonovi 2
3| Methodology Macro-scale hydrodynamic model Flood Risk Analysis GCM based Low resolution (2 -5 ) Energy balance Land surface schemes High resolution flow 10-25km resolution SHARCNET CamaFlood (Catchment-Based hydrodynamic model) Sub-grid topographic parameters Overlapping Hazard with the exposure Population overlapping with the runoff projections High resolution flow projection Low resolution future runoff projection Change in Flood Risk across Canada under Changing Climate Ayushi Gaur, Abhishek Gaur, Professor Slobodan P. Simonovi 3
CamaFlood 4| Grid based river and floodplain routing calculations Runoff forcing from land surface schemes within GCMs used as input Flow calculation in each grid specific unit-catchment Water storage is the only prognostic variable, other variables are derived empirically Up-scaled river network map is prepared using Flexible Location of Waterways ( FLOW ) method Change in Flood Risk across Canada under Changing Climate Ayushi Gaur, Abhishek Gaur, Professor Slobodan P. Simonovi 4
5| Work completed since last progress meeting Continuous daily simulation of historical (1961-2016) and future flow projections (2017-2100) across Canada Input daily flow data obtained from 23 Global Climate Models taking all available emission scenarios Change in 100 year and 250 year return period flood magnitude estimated Flood frequency analysis is performed by fitting the annual maximum flows using Generalized extreme value (GEV) distribution Scale, shape and location parameters estimated using method of moments 11 out of 23 GCMs flood frequency analysis is done using SHARCNET Change in Flood Risk across Canada under Changing Climate Ayushi Gaur, Abhishek Gaur, Professor Slobodan P. Simonovi 5
6| Return period change of historical flood event RCP2.6 Change in Flood Risk across Canada under Changing Climate Ayushi Gaur, Abhishek Gaur, Professor Slobodan P. Simonovi 6
7| Return period change of historical flood event RCP4.5 Change in Flood Risk across Canada under Changing Climate Ayushi Gaur, Abhishek Gaur, Professor Slobodan P. Simonovi 7
Return period change of historical flood event 8| RCP6.0 Change in Flood Risk across Canada under Changing Climate Ayushi Gaur, Abhishek Gaur, Professor Slobodan P. Simonovi 8
9| Return period change of historical flood event RCP8.5 Change in Flood Risk across Canada under Changing Climate Ayushi Gaur, Abhishek Gaur, Professor Slobodan P. Simonovi 9
Conclusions 10| CamaFlood is a state-of-the-art hydrodynamic model that can be used to perform flood risk assessment across Canada Model validation over historical period shows promising results Model performance is found sensitive to parameters and location of analysis Changes in flood frequency as projected by different GCMs and RCPs are found to be considerably different from one another Future flood hazard varies significantly over different regions of Canada Change in Flood Risk across Canada under Changing Climate Ayushi Gaur, Abhishek Gaur, Professor Slobodan P. Simonovi 10
11| Conclusions Uncertainty sources: Selection of Global Climate Models Selection of carbon emission scenarios Flood frequency is different for different GCMs and RCPs Most of the GCMs are showing increase in flood frequency and decrease in return period in the areas: Northern Canada - Yukon, Nunavut, Northwest Territories; Western Canada - British Columbia, Alberta South Ontario Change in Flood Risk across Canada under Changing Climate Ayushi Gaur, Abhishek Gaur, Professor Slobodan P. Simonovi 11
Interpretation and future work 12| Downscale and analyse runoff projections for rest of the GCMs. Projected changes can be linked to climatic factors such as: precipitation and temperature change, to explain differences in projections from different GCMs. Need to find a way to combine the results from multiple GCMs to ascertain spatial distribution of flood hazard. Compare flow projections obtained from GCMs with CamaFlood derived projections. What fraction of flood hazard translates to flood risk? Change in Flood Risk across Canada under Changing Climate Ayushi Gaur, Abhishek Gaur, Professor Slobodan P. Simonovi 12
Interpretation and future work 13| Flood Risk = Flood hazard * Exposure(Population) Change in Flood Risk across Canada under Changing Climate Ayushi Gaur, Abhishek Gaur, Professor Slobodan P. Simonovi 13
References 14| Doxsey-Whitfield, E., K. MacManus, S.B. Adamo, L. Pistolesi, J. Squires, O. Borkovska and S.R. Baptista. 2015. Taking Advantage of the Improved Availability of Census Data: A First Look at the Gridded Population of the World, Version 4. Papers in Applied Geography 1(3): 1-9. http://dx.doi.org/10.1080/23754931.2015.1014272 Yamazaki, D., (2014). The global hydrodynamic model CaMa-Flood (version 3.6.2), Japan Agency for Marine-Earth Science and Technology, retrieved from website: http://hydro.iis.u- tokyo.ac.jp/~yamadai/cama-flood/Manual_CaMa-Flood_v362.pdf Yamazaki, D., Oki, T., and Kanae, S., 2009. Deriving a global river network map and its sub-grid topographic characteristics from a fine-resolution flow direction map. Hydrology and Earth System Sciences, 13, 2241 2251 Bates,P., Trigg,M., Neal, J., and Dabrowa,A., (2013). LISFLOOD-FP, User manual, School of Geographical Sciences, University of Bristol. University Road, Bristol, BS8 1SS, UK. Retrieved from website: http://www.bristol.ac.uk/media-library/sites/geography/migrated/documents/lisflood- manual-v5.9.6.pdf. Hirabayashi, Y., Mahendran, R., Koirala, S., Konoshima, L., Yamazaki, D., Watanabe, S., Kanae, S. (2013). Global flood risk under climate change. Nature Climate Change, 3(9), 816 821. doi:10.1038/nclimate1911. IPCC, 2007: Climate Change 2007: The Physical Science Basis. Contribution of Working Group I to the Fourth Assessment Report of the Intergovernmental Panel on Climate Change [Solomon, S., D. Qin, M. Manning, Z. Chen, M. Marquis, K.B. Averyt, M. Tignor and H.L. Miller (eds.)]. Cambridge University Press, Cambridge, United Kingdom and New York, NY, USA, 996 pp. Huber, M., & Knutti, R. (2011). Anthropogenic and natural warming inferred from changes in Earth s energy balance. Nature Geoscience, 5(1), 31 36. doi:10.1038/ngeo1327. 14
