Analyzing Caloric Intake: Urban vs. Rural Adolescents
Explore the comparison of daily caloric intake between urban and rural adolescents through nutritional studies. Analyze boxplots displaying calories consumed per kilogram and identify outliers using 1.5xIQR rule. Understand standard deviation, boxplots, and the impact of outliers on data analysis. Utilize a calculator for statistical calculations and graphical representations. Estimate the duration of a minute and compare estimates using modified boxplots.
Download Presentation

Please find below an Image/Link to download the presentation.
The content on the website is provided AS IS for your information and personal use only. It may not be sold, licensed, or shared on other websites without obtaining consent from the author. If you encounter any issues during the download, it is possible that the publisher has removed the file from their server.
You are allowed to download the files provided on this website for personal or commercial use, subject to the condition that they are used lawfully. All files are the property of their respective owners.
The content on the website is provided AS IS for your information and personal use only. It may not be sold, licensed, or shared on other websites without obtaining consent from the author.
E N D
Presentation Transcript
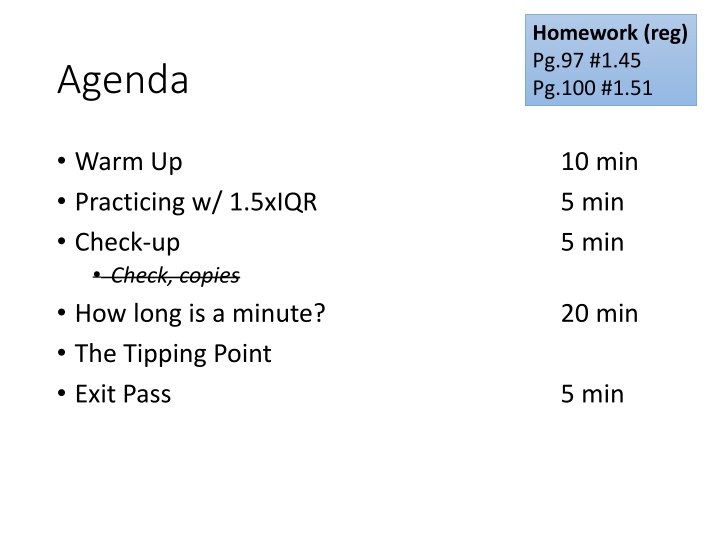
Homework (reg) Pg.97 #1.45 Pg.100 #1.51 Agenda Warm Up Practicing w/ 1.5xIQR Check-up Check, copies How long is a minute? The Tipping Point Exit Pass 10 min 5 min 5 min 20 min 5 min
Warm Up The goal of a nutritional study was to compare the caloric intake of adolescents living in rural areas of the US with the caloric intake of adolescents living in urban areas of the US. A random sample of 9th- graders from a rural high school was selected. Another random sample of 9th-graders from an urban high school was also selected. Every student recorded all food they consumed in one day. Let s review boxplots The boxplots below display the number of calories of food consumed per kilogram of body weight for each student. Write a few sentences comparing the distribution of the daily caloric intake of each group. Urban Rural
1.5xIQR drill For each of the following data sets, identify any outliers. Show your work. No calculator graphs. 1. Window. 0, 0, 5, 6, 7, 12 2. Door. 1, 2, 2.3, 5, 7, 12 3. Window. 10, 20, 30, 110, 111, 112 4. Door. -17, -5, 0, 11, 25, 26, 30, 31, 76 No outliers!
1 of 2 Notes Standard Deviation P.2 0 0 0 0 0 0 0 0 0 1 1 1 2 2 2 2 2 2 2 3 3 3 3 3 Average distance from mean. Average of the squares of the deviations from the mean Only use when the mean is chosen as the measure of center Sensitive to outliers 2.25 3.5 4 5 5 8 9 or 1.54
2 of 2 P.2 0 0 0 0 0 0 0 0 0 1 1 1 2 2 2 Notes Boxplots 2 2 2 2 3 3 3 3 3 Represent 5-number summary on # line Modified boxplot = outliers shown Min 0 0 Q1 0 0 Med 2 2 Q3 3 3 3.5 4 5 5 8 9 Max 9 5 0 1 2 3 4 5 6 7 8 9 10 11
Everything is on the calculator! 0 1 5 5 7 11 12 15 21 25 35 40 50 50 100 Type data into List at STAT 1:Edit Numerical summary Mean, standard deviation, 5# summary . STAT CALC 1:1-Var Stats Histograms and boxplots 2nd STAT PLOT Enter (Turn Plot ON) Histogram is graph type #3 Modified boxplot (shows outliers) is graph type #4 Boxplot is graph type #5 Can t see graph? Try ZOOM 9:ZoomStat
How long is a minute? Give me your estimates. In L1, enter the first estimates of the class: 1. Both partners. Use your calculator to make a modified boxplot of the class first estimates. Compare calculators. 2. Both partners. Use your calculator to make a histogram. Compare calculators. 3. DOOR. Describe the distribution to your partner. In L2, enter the averages of the class: 1. Both partners. Use your calculator to make 2 simultaneous modified boxplots of both the first estimates and average estimates. Compare calculators. 2. Both partners. Use your calculator to 2 simultaneous histograms of both the first estimates and average estimates. . Compare calculators. 3. WINDOW. Compare these two distributions.
Fridays test You re allowed an index card on all tests. Only one side. Index card must be 3 x 5 . Practice test.
Homework (reg) Pg.97 #1.45 Pg.100 #1.51 Exit Pass 1. What is the standard deviation and IQR of the following numbers: 5, 7, 9, 10, 15, 17, 18, 21, 25, 35, 48 2. Is 48 an outlier? Justify.


