Analysis of Presidential Nominees Coverage Trends 1960-2016

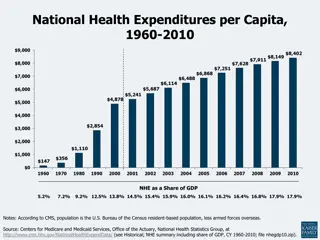
This data analysis presents the tone and coverage of news reports on presidential nominees, focusing on negative and positive aspects, fitness for office, and selected topics over different election periods. The data showcases how media portrayal of nominees has evolved and highlights key trends in coverage over the years.

Download Presentation

Please find below an Image/Link to download the presentation.
The content on the website is provided AS IS for your information and personal use only. It may not be sold, licensed, or shared on other websites without obtaining consent from the author.If you encounter any issues during the download, it is possible that the publisher has removed the file from their server.
You are allowed to download the files provided on this website for personal or commercial use, subject to the condition that they are used lawfully. All files are the property of their respective owners.
The content on the website is provided AS IS for your information and personal use only. It may not be sold, licensed, or shared on other websites without obtaining consent from the author.
E N D
Presentation Transcript
figure 1. Tone of Nominees Coverage percentage of news reports Negative Positive General Election 77% Trump 23% 64% Clinton 36% Full Campaign 56% Trump 44% 62% Clinton 38% Source: Media Tenor. Full campaign covers period from Jan 1, 2015-Nov 6, 2016. General election covers period from Aug 8-Nov 6, 2016. Excludes reports that were neutral in tone. Such reports accounted for about a third of the coverage.
figure 2. Tone of Nominees Coverage on Topics Relating to Their Fitness for Office percentage of news reports Negative Positive 87% Trump 13% 87% Clinton 13% Source: Media Tenor. The fitness category includes news reports on candidates policy positions, personal qualities, leadership abilities, ethical standards, and the like. Excludes reports that were neutral in tone.
figure 3 figure 3. Tone of Presidential Nominees Coverage, . Tone of Presidential Nominees Coverage, 1960 1960- -2016 2016 percentage of nominees news coverage Negative 76 75 71 66 67 61 60 63 57 64 61 54 57 59 57 41 43 46 39 43 36 43 37 33 40 39 34 29 25 24 Positive 196019641968197219761980198419881992199620002004200820122016 Sources: Patterson, Out of Order, 1960-92; Center for Media & Public Affairs, 1996; Pew Research Center, 2000-2012; Media Tenor, 2016. Neutral stories are excluded. Percentages are the average each election for the two major-party nominees.
figure 4 figure 4. Tone of Coverage of Selected Topics, . Tone of Coverage of Selected Topics, 2010 2010- -2016 2016 percentage of news reports Negative Positive 84 Immigration 16 87 Muslims 13 71 Health policy 29 70 Economy 30 Source: Media Tenor. Based on news reports on CBS and NBC evening newscasts. Excludes neutral stories.
figure 5 figure 5. Nominees Coverage, by Week . Nominees Coverage, by Week percentage of news reports Trump 55 56 55 55 55 53 54 52 53 51 51 52 52 48 48 48 49 49 47 46 47 45 45 45 44 45 Clinton Source: Media Tenor. Percentages based on Trump and Clinton coverage only. Other presidential candidates and the the vice-presidential nominees are excluded. Also excludes neutral reports. Date shown is the end date for that week s coverage.
figure 6 figure 6. Campaign Coverage by Topic . Campaign Coverage by Topic percentage of news reports Other 24% Horserace 42% Controversies 17% Policy stands 10% Leadership/ experience 3% Personal traits 4% Source: Media Tenor. The other category includes references to such things as upcoming events, staffing, logistics, etc.
figure 7 figure 7. Tone of Campaign Coverage, by Topic . Tone of Campaign Coverage, by Topic percentage of news stories about . . . Negative Positive 59% Horserace 41% 91% Controversies 9% 84% Policy stands 16% 80% Personal qualities 20% 73% Leadership/experience 27% Source: Media Tenor. Percentages exclude news reports that were neutral in tone.
figure 8 figure 8. Tone of Trump s Coverage, by Week . Tone of Trump s Coverage, by Week percentage of Trump news reports Negative Positive 94 91 87 83 79 77 76 71 70 76 65 68 67 29 32 35 23 24 30 33 17 24 13 21 9 6 Source: Media Tenor. Excludes neutral reports. Date shown is the end date for that week s coverage.
figure 9. Tone of Trumps Coverage, by News Outlet percentage of Trump s coverage Negative Positive 89 CBS 11 88 USA Today 12 87 Washington Post 13 86 Los Angeles Times 14 86 New York Times 14 83 NBC 17 81 ABC 19 81 CNN 19 80 Wall Street Journal 20 73 Fox 27 Source: Media Tenor. Excludes neutral news reports.
figure 10 figure 10. Topics of Trump s Coverage . Topics of Trump s Coverage percentage of news stories Other 23% Horserace 42% Controversies 15% Policy stands 12% Leadership/ experience 4% Personal traits 4% Source: Media Tenor. The other category includes references to such things as upcoming events, staffing, logistics, etc.
figure 11 figure 11. Tone of Trump s Coverage, by Topic . Tone of Trump s Coverage, by Topic percentage of news reports about . . . Negative Positive 78% Horserace 22% 92% Controversies 8% 85% Policy stands 15% 82% Personal qualities 18% 93% Leadership/experience 7% Source: Media Tenor. Percentages exclude neutral news reports.
figure 12 figure 12. Tone of Clinton s Coverage, by Week . Tone of Clinton s Coverage, by Week percentage of Clinton news reports Negative Positive 79 79 74 67 72 63 61 60 57 58 52 53 59 47 42 43 48 40 41 39 28 37 33 26 21 21 Source: Media Tenor. Excludes neutral news reports. Date shown is the end date for that week s coverage. .
figure 13. Tone of Clintons Coverage, by News Outlet percentage of Clinton coverage Negative Positive 81 Fox 19 77 Washington Post 23 70 USA Today 30 67 CNN 33 63 ABC 37 63 NBC 37 63 Wall Street Journal 37 61 CBS 39 61 New York Times 39 53 Los Angeles Times 47 Source: Media Tenor. Excludes neutral news reports.
figure 14 figure 14. Topics of Clinton s Coverage . Topics of Clinton s Coverage percentage of coverage Other 22% Horserace 43% Controversies 19% Policy stands 9% Leadership/ experience 2% Personal traits 4% Source: Media Tenor. The other category includes references to such things as upcoming events, staffing, logistics, etc.
figure 15 figure 15. Tone of Debate Coverage . Tone of Debate Coverage percentage of debate-related stories about . . . Negative Positive 35% Clinton 6% 82% Trump 18% Source: Media Tenor. Percentages exclude news reports that were neutral in tone.
figure 16 figure 16. Tone of Clinton s Coverage, by Topic . Tone of Clinton s Coverage, by Topic tone of news stories about . . . Negative Positive 38% Horserace 62% 91% Controversies 9% 82% Policy stands 18% 77% Personal qualities 23% 61% Leadership/experience 39% Source: Media Tenor. Percentages exclude news reports that were neutral in tone.
figure 17 figure 17. Clinton s Scandal Coverage, by . Clinton s Scandal Coverage, by Week Week percentage of Clinton s coverage 37 23 20 15 14 15 10 14 13 8 7 7 7 Source: Media Tenor. Date shown is the end date for that week s coverage.