LLVM Line Coverage Profiling Implementation Overview
Line coverage profiling in LLVM is implemented using built-in instrumentation facilities. This approach involves inserting PGO probes, interpreting them as coverage measurements, and generating coverage reports to assess the coverage of a test suite. The process allows for generating profile information at both the source instruction and IR levels, enabling dynamic analysis of the instrumented code.

Download Presentation

Please find below an Image/Link to download the presentation.
The content on the website is provided AS IS for your information and personal use only. It may not be sold, licensed, or shared on other websites without obtaining consent from the author.If you encounter any issues during the download, it is possible that the publisher has removed the file from their server.
You are allowed to download the files provided on this website for personal or commercial use, subject to the condition that they are used lawfully. All files are the property of their respective owners.
The content on the website is provided AS IS for your information and personal use only. It may not be sold, licensed, or shared on other websites without obtaining consent from the author.
E N D
Presentation Transcript
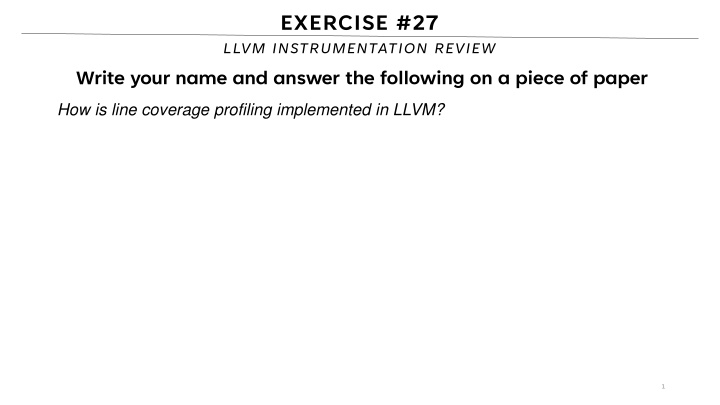
EXERCISE #27 LLVM INSTRUMENTATION REVIEW Write your name and answer the following on a piece of paper How is line coverage profiling implemented in LLVM? 1
ADMINISTRIVIA AND ANNOUNCEMENTS
LLVM INSTRUMENTATION EECS 677: Software Security Evaluation Drew Davidson
4 WHERE WE RE AT EXPLORING PROGRAM INSTRUMENTATION An approach to dynamic analysis
5 PREVIOUSLY: STATIC INSTRUMENTATION REVIEW: LAST LECTURE PRACTICAL TOOLSFOR PROGRAM INSTRUMENTING GCC Internal transformation passes LLVM opt IR rewriting USAGEOF LLVM BUILT-IN INSTRUMENTATION ANALYSIS SETUPFORA CUSTOM LLVM ANALYSIS
6 THIS LESSON: WRITING INSTRUMENTATION OUTLINE / OVERVIEW PRACTICAL TOOLSFOR PROGRAM INSTRUMENTING GCC Internal transformation passes LLVM opt IR rewriting Providing more detail USAGEOF LLVM BUILT-IN INSTRUMENTATION ANALYSIS Presenting an example SETUPFORA CUSTOM LLVM ANALYSIS
7 SETUP / ASSUMPTIONS LLVM BUILT-IN INSTRUMENTATION THISPORTIONOFTHELECTUREUSESACLANG++ INSTALLATION. Should work for many versions of LLVM (tested on clang++-9) Works on clang++14 (which is installed on the cycle servers) INSTALLATION (ONALOCALMACHINE) sudo apt install clang++ llvm-dev
8 LLVM COVERAGE INSTRUMENTATION LLVM BUILT-IN INSTRUMENTATION GOAL: ASSESSTHECOVERAGEOFATESTSUITE APPROACH: USELLVM SBUILT-IN INSTRUCTION INSTRUMENTATION Piggyback on LLVM s PGO facilities 1) Insert PGO probes 2) Interpret probes as coverage measurements 3) Generate a coverage report
9 LLVM: INSERTING PGO PROBES LLVM BUILT-IN INSTRUMENTATION -fprofile-instr-generate Generate profile information at the source instruction level -fprofile-generate Generate profile information at the IR level We can actually see the instrumented code live!
10 LLVM: INSERTING PGO PROBES LLVM BUILT-IN INSTRUMENTATION Let s write a simple LLVM program, then observe the probes clang++ prog.ll o prog-instr.ll -fprofile-generate emit-llvm
11 LLVM COVERAGE INSTRUMENTATION LLVM BUILT-IN INSTRUMENTATION GOAL: ASSESSTHECOVERAGEOFATESTSUITE APPROACH: USELLVM SBUILT-IN INSTRUCTION INSTRUMENTATION Piggyback on LLVM s PGO facilities 1) Insert PGO probes 2) Interpret probes as coverage measurements 3) Generate a coverage report
12 LLVM: COVERAGE MAPPING LLVM BUILT-IN INSTRUMENTATION For understanding line coverage, we need to map changes to source code clang++ prog.ll o prog -fprofile-instr-generate emit-llvm -fcoverage-mapping This will cause the program to output an additional coverage file in the location of the environment variable LLVM_PROFILE_FILE export LLVM_PROFILE_FILE=test1.prof
13 LLVM COVERAGE INSTRUMENTATION LLVM BUILT-IN INSTRUMENTATION GOAL: ASSESSTHECOVERAGEOFATESTSUITE APPROACH: USELLVM SBUILT-IN INSTRUCTION INSTRUMENTATION Piggyback on LLVM s PGO facilities 1) Insert PGO probes 2) Interpret probes as coverage measurements 3) Generate a coverage report
14 LLVM: COVERAGE REPORT LLVM BUILT-IN INSTRUMENTATION The profile file is useful for a variety of things (i.e. PGO). As such, it is not (immediately) human-readable We ll use some extra tools to generate a readable report llvm-profdata merge -sparse test1.prof -o final.profdata llvm-cov-9 show badcalc -instr-profile=final.profdata >& profile.report
15 PUTTING IT ALL TOGETHER REVIEW: LAST LECTURE THESECOMMANDSWORKFINEFOR 1 TESTRUN, BUTWECAREABOUTTEST SUITES clang++ prog.ll o prog -fprofile-instr-generate -fcoverage-mapping export LLVM_PROFILE_FILE=test1.prof ./prog export LLVM_PROFILE_FILE=test2.prof ./prog llvm-profdata merge -sparse test*.prof -o final.profdata llvm-cov-9 show badcalc -instr-profile=final.profdata >& profile.report
16 THIS LESSON: WRITING INSTRUMENTATION OUTLINE / OVERVIEW PRACTICAL TOOLSFOR PROGRAM INSTRUMENTING GCC Internal transformation passes LLVM opt IR rewriting Providing more detail USAGEOF LLVM BUILT-IN INSTRUMENTATION ANALYSIS Presenting an example SETUPFORA CUSTOM LLVM ANALYSIS
17 EXAMPLE: CUSTOM LLVM INSTRUMENTATION PROGRAM INSTRUMENTATION: APPROACH LET SREMOVEAND ADDSOMEINSTRUCTIONS! Consider a simple add2 program: #include <stdio.h> int main(int argc, const char** argv) { int num; scanf("%i", &num); printf("%i\n", num + 2); return 0; }
18 EXAMPLE: LLVM COVERAGE INSTRUMENTATION PROGRAM INSTRUMENTATION: APPROACH LET STAKEITTOTHETERMINAL!
19 WRAP-UP WE VE DESCRIBED THE THEORY AND PRACTICE OF PROGRAM INSTRUMENTATION Next time: Consider how we generate test cases