Analysis of Oil Sales and Revenues in Nigeria, 2009-2015
Comparison of oil prices vs. Federation Account oil sale receipts, reported earnings vs. treasury receipts, oil-for-product swap deals, NNPC trading subsidiaries, and more in Nigeria from 2009 to 2015, including significant losses and contract holders.
Download Presentation

Please find below an Image/Link to download the presentation.
The content on the website is provided AS IS for your information and personal use only. It may not be sold, licensed, or shared on other websites without obtaining consent from the author.If you encounter any issues during the download, it is possible that the publisher has removed the file from their server.
You are allowed to download the files provided on this website for personal or commercial use, subject to the condition that they are used lawfully. All files are the property of their respective owners.
The content on the website is provided AS IS for your information and personal use only. It may not be sold, licensed, or shared on other websites without obtaining consent from the author.
E N D
Presentation Transcript
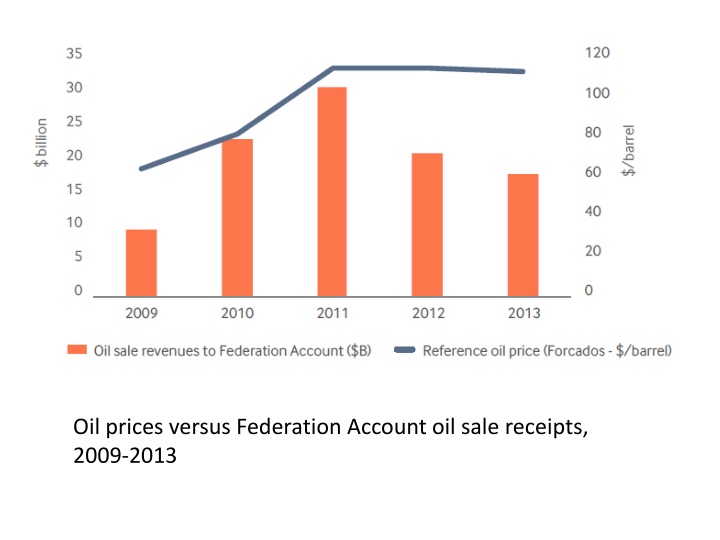
Oil prices versus Federation Account oil sale receipts, 2009-2013
Reported domestic crude sale earnings versus treasury receipts, 2004-2013
The oil-for-product swap deals 210,000 barrels per day Oil worth around $7b/yr during Jonathan years Losses of at least $16 / barrel Total losses top $400 million per year
NNPC trading subsidiaries Nigerian Petroleum Development Company (NPDC) Oil sold = approx. 80,000 b/d Oil sale revenues = around $4 billion per year in 2012- 2013 Known transfers to the treasury = $0
