Analysis of Medicaid Patient Demographics and Opioid Prescriptions


Opioid Prescription Patterns
Department of Health and Human Services
Director’s Office
Jeffery Stroup, Econometrician
Richard Whitley, MS
Director
Brian Sandoval
Governor


Data
•
Data was gathered from the Medicaid data
warehouse.
•
Data covers the period from October 2014 to
September 2015.
•
Data contains demographics, diagnoses,
amount of opioids received, type of opioid
received, provider information, and which
pharmacy used for each Medicaid patient.
2
Demographics of Medicaid Patients
Who Received Opioids – Age Group
Department of Health and Human Services
3
N =154,572
Demographics of Medicaid Patients
Who Received Opioids – Race
Department of Health and Human Services
4
Demographics of Medicaid Patients
Who Received Opioids – Gender
Department of Health and Human Services
5
N =775,085
Demographics of Medicaid Patients
Who Received Opioids – Region
6
N =154,572
Opioid Conversion
•
Due to the varying types and strengths of
opioids prescribed, it is necessary to convert
dosages into milligrams of morphine
equivalents to make comparisons across
providers and Medicaid patients.
•
One milligram (mg) of morphine taken orally is
equal to one milligram of morphine
equivalent.
7
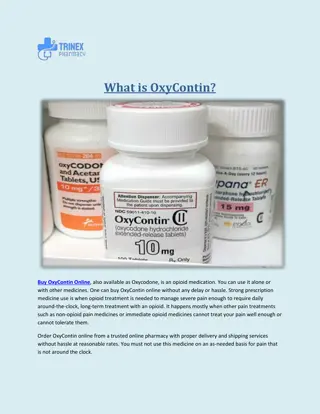
Opioid Conversion Example
•
Example: 10 mg oxycodone tablet
–
The conversion factor is 2:3
•
2 mg of oxycodone taken orally = 3 mg of morphine equivalent
–
10 mg of oxycodone taken orally is equivalent to 15 mg of
morphine equivalent.
8
Medicaid Patient Opioid
Characteristics
•
There were 154,572 Medicaid patients
who received a prescription for
opioids between October 2014 and
September 2015.
•
The average Medicaid patient who
received an opioid prescription
received a total of 6,685 mg of
morphine equivalents over the course
of the year.
•
This number is skewed by patients
receiving the greatest amount of
opioids, as half of Medicaid patients
who received opioids received 305 mg
or less of morphine equivalents.
•
The Medicaid patient with the largest
total prescribed milligrams was
prescribed 1.8 million mg of morphine
equivalents.
Department of Health and Human Services
9
Number of Providers Who Provided Care to a
Medicaid Patient who Received Opioids
•
A provider can be a Physician (MD), a Doctor of
Osteopathy (DO), a Dentist (DDS), a Nurse
Practitioner (APN), or a Physician Assistant (PA).
•
The average Medicaid patient will receive care
from two providers.
•
Half of Medicaid patients only see one provider
for opioids.
•
The greatest number of opioid prescribing
providers a Medicaid patient received services
from was 94.
10
Average Number of Providers Who Provided Care to a
Medicaid Patient who Received Opioids by Decile
11
Median
Average Number of Prescriptions Each Medicaid
Patient who Received Opioids Received for Opioids
by Decile
12
Median
Number of Pharmacies Frequented by
Medicaid Patients to Fill Opioid Prescriptions
•
Medicaid patients who were prescribed
opioids filled prescriptions at two pharmacies
on average.
•
About two-thirds of Medicaid patients who
were prescribed opioids only used one
pharmacy.
•
The most pharmacies that a Medicaid patient,
who was prescribed an opioid medication, use
was 32 pharmacies.
13
Average Number of Pharmacies Frequented by
Medicaid Patients to Fill Opioid Prescriptions by Decile
14
Median
Case Examples - Location
Department of Health and Human Services
15
Clark County
•
White, Female, 0-18
•
Would receive 3,006
mg of morphine
equivalents on
average over the
course of the year
Washoe County
•
White, Female, 0-18
•
Would receive 1,140
mg of morphine
equivalent on
average over the
course of the year
Case Examples - Race
Department of Health and Human Services
16
Rural Counties
•
Hispanic, Male, 55-
64
•
Would receive 8,046
mg of morphine
equivalents on
average over the
course of the year
•
White, Male, 55-64
•
Would receive
12,111 mg of
morphine
equivalents on
average over the
course of the year.
Total Amount of Morphine Equivalent
by Provider
Department of Health and Human Services
17
•
There were 9,359 providers who
wrote prescriptions for opioids to
Medicaid patients between
October 2014 and September
2015.
•
The average provider prescribed a
total of 110,401 mg of morphine
equivalent over the course of the
year.
•
Half of providers prescribed 1,688
mg or less over the course of the
year.
•
The provider with the largest
amount of opioids prescribed
wrote prescriptions for a total
amount of 24.5 million mg of
morphine equivalents.
Number of Opioid Prescriptions Written by
Each Provider to Medicaid Clients
•
The average provider wrote 78 opioid
prescriptions to Medicaid patients over the
course of the year.
•
Half of providers who wrote prescriptions for
opioids wrote six or less prescriptions to
Medicaid patients over the year.
•
The top prescribing provider wrote 6,539
prescriptions for opioids over the course of the
year.
–
This equates to about 25 prescriptions a day assuming
a five day work week and 52 weeks in a year.
18
Average Number of Opioid Prescriptions Written
by Each Provider to Medicaid Clients by Decile
19
Median
Number of Unique Medicaid
Patients per Provider
•
A unique Medicaid patient is any patient who sees a
provider and receives a prescription for an opioid one or
more times.
•
Unique Medicaid patients may see one or more providers.
•
The average provider will provide care to 36 unique
Medicaid patients who received opioids.
•
Half of providers will provide care to fewer than five unique
Medicaid patients who will receive opioids.
•
The top provider saw 2,191 unique Medicaid patients. This
was a hospital.
•
The top non-hospital provider saw 1,773 unique Medicaid
patients.
20
Average Number of Unique
Patients per Provider
21
Median
Next Steps
•
Expand analysis to include diagnosis codes when
examining difference between total patient
milligrams
•
Analyze the difference in prescribing patterns of
providers based on diagnoses, location, specialty,
and credential.
•
Individual provider prescribing pattern analysis
.
22
The DHCFP data warehouse is comprised of claims data submitted by over 15,000 Medicaid providers from within Nevada and
across the country. While DHCFP staff conscientiously make their best efforts to validate this data through continuous provider
education and the use of a highly experienced audit staff, the Division heavily relies on its providers to submit accurate and complete
information on our Medicaid patients.
It should therefore be understood by the users of DHCFP reports on disease morbidity and patient health that the data source for
these reports is based solely on patient claims data and may not be a complete and comprehensive health record.
Opioid Equivalent Conversion Factor
Sources
•
Centers for Medicare & Medicaid Services
–
https://www.cms.gov/Medicare/Prescription-Drug-
Coverage/PrescriptionDrugCovContra/Downloads/Opioid-
Morphine-EQ-Conversion-Factors-March-2015.pdf
•
Medscape
–
http://emedicine.medscape.com/article/2138678-overview
•
Washington State Agency Medical Directors’ Group
–
http://www.agencymeddirectors.wa.gov/Calculator/DoseCalcul
ator.htm
23
Total Milligrams by Patient Characteristics
*** Significant at the 1% level
Constant represents the average milligrams
of morphine equivalent prescribed to a
White, Female, Clark County Resident who is
0 to 18 years old over the course of a year.
Data gathered from the Medicaid data warehouse from October 2014 to September 2015 reveals demographics of Medicaid patients receiving opioids in terms of age groups, race, gender, and region. The information includes percentages of patients in each category, such as age ranges, racial backgrounds, gender distribution, and regional allocation. The opioid conversion process is highlighted to standardize dosages into morphine equivalents for comparison across providers and patients.

Download Presentation

Please find below an Image/Link to download the presentation.
The content on the website is provided AS IS for your information and personal use only. It may not be sold, licensed, or shared on other websites without obtaining consent from the author. Download presentation by click this link. If you encounter any issues during the download, it is possible that the publisher has removed the file from their server.
E N D
Presentation Transcript
Brian Sandoval Governor Richard Whitley, MS Director Opioid Prescription Patterns Department of Health and Human Services Director s Office Jeffery Stroup, Econometrician
Data Data was gathered from the Medicaid data warehouse. Data covers the period from October 2014 to September 2015. Data contains demographics, diagnoses, amount of opioids received, type of opioid received, provider information, and which pharmacy used for each Medicaid patient. 2
Demographics of Medicaid Patients Who Received Opioids Age Group Opioid Receiving Patients All Medicaid Patients 75-84 1% 85 plus 0% 65-74 3% 75-84, 2% 85 Plus, 1% 65-74, 3% 0-18 11% 55-64, 7% 55-64 15% 19-25 13% 45-54, 9% 0-18, 46% 35-44, 10% 45-54 18% 26-34 21% 26-34, 12% 35-44 18% 19-25, 10% N =775,085 N =154,572 Department of Health and Human Services 3
Demographics of Medicaid Patients Who Received Opioids Race Opioid Receiving Patients All Medicaid Patients Other 10% Other 9% White 38% Hispanic 21% White 48% Hispanic 34% Black 22% Black 18% N =154,572 N =775,085 Department of Health and Human Services 4
Demographics of Medicaid Patients Who Received Opioids Gender Opioid Receiving Patients All Medicaid Patients Male 37% Male 46% Female 54% Female 63% N =154,572 N =775,085 Department of Health and Human Services 5
Demographics of Medicaid Patients Who Received Opioids Region Opioid Receiving Patients All Medicaid Patients Out of State 1% Out of State 1% Rural 11% Rural 10% Washoe 14% Washoe 15% Clark 75% Clark 73% N =154,572 N =775,085 6
Opioid Conversion Due to the varying types and strengths of opioids prescribed, it is necessary to convert dosages into milligrams of morphine equivalents to make comparisons across providers and Medicaid patients. One milligram (mg) of morphine taken orally is equal to one milligram of morphine equivalent. 7
Opioid Conversion Example Example: 10 mg oxycodone tablet The conversion factor is 2:3 2 mg of oxycodone taken orally = 3 mg of morphine equivalent 10 mg of oxycodone taken orally is equivalent to 15 mg of morphine equivalent. 8
Medicaid Patient Opioid Characteristics Percentage of Total Opioids Received by Medicaid Patients Oct 2014 Sep 2015 There were 154,572 Medicaid patients who received a prescription for opioids between October 2014 and September 2015. The average Medicaid patient who received an opioid prescription received a total of 6,685 mg of morphine equivalents over the course of the year. This number is skewed by patients receiving the greatest amount of opioids, as half of Medicaid patients who received opioids received 305 mg or less of morphine equivalents. The Medicaid patient with the largest total prescribed milligrams was prescribed 1.8 million mg of morphine equivalents. Bottom 90% 17% Top 10% 83% Department of Health and Human Services 9
Number of Providers Who Provided Care to a Medicaid Patient who Received Opioids A provider can be a Physician (MD), a Doctor of Osteopathy (DO), a Dentist (DDS), a Nurse Practitioner (APN), or a Physician Assistant (PA). The average Medicaid patient will receive care from two providers. Half of Medicaid patients only see one provider for opioids. The greatest number of opioid prescribing providers a Medicaid patient received services from was 94. 10
Average Number of Providers Who Provided Care to a Medicaid Patient who Received Opioids by Decile 8 7 7 Prescribing Providers 6 5 4 4 3 3 2 2 2 1 1 1 1 1 Median 1 0 Bottom Decile Second Decile Third Decile Fourth Decile Fifth Decile Sixth Decile Seventh Decile Eighth Decile Ninth Decile Top Decile Medicaid Patients 11
Average Number of Prescriptions Each Medicaid Patient who Received Opioids Received for Opioids by Decile 25 21 20 Prescriptions 15 10 10 5 5 3 2 2 1 1 1 1 Median 0 Bottom Decile Second Decile Third Decile Fourth Decile Fifth Decile Sixth Decile Seventh Decile Eighth Decile Ninth Decile Top Decile Medicaid Patients 12
Number of Pharmacies Frequented by Medicaid Patients to Fill Opioid Prescriptions Medicaid patients who were prescribed opioids filled prescriptions at two pharmacies on average. About two-thirds of Medicaid patients who were prescribed opioids only used one pharmacy. The most pharmacies that a Medicaid patient, who was prescribed an opioid medication, use was 32 pharmacies. 13
Average Number of Pharmacies Frequented by Medicaid Patients to Fill Opioid Prescriptions by Decile 5 4 4 3 Pharmacies 2 2 2 1 1 1 1 1 1 1 1 Median 0 Bottom Decile Second Decile Third Decile Fourth Decile Fifth Decile Sixth Decile Seventh Decile Eighth Decile Ninth Decile Top Decile Medicaid Clients 14
Case Examples - Location Clark County White, Female, 0-18 Would receive 3,006 mg of morphine equivalents on average over the course of the year Washoe County White, Female, 0-18 Would receive 1,140 mg of morphine equivalent on average over the course of the year Department of Health and Human Services 15
Case Examples - Race Rural Counties Hispanic, Male, 55- 64 Would receive 8,046 mg of morphine equivalents on average over the course of the year White, Male, 55-64 Would receive 12,111 mg of morphine equivalents on average over the course of the year. Department of Health and Human Services 16
Total Amount of Morphine Equivalent by Provider There were 9,359 providers who wrote prescriptions for opioids to Medicaid patients between October 2014 and September 2015. The average provider prescribed a total of 110,401 mg of morphine equivalent over the course of the year. Half of providers prescribed 1,688 mg or less over the course of the year. The provider with the largest amount of opioids prescribed wrote prescriptions for a total amount of 24.5 million mg of morphine equivalents. Percentage of Total Opioids Prescribed to Medicaid Patients Oct 2014 to Sept 2015 Bottom 90% 8% Top 10% 92% Department of Health and Human Services 17
Number of Opioid Prescriptions Written by Each Provider to Medicaid Clients The average provider wrote 78 opioid prescriptions to Medicaid patients over the course of the year. Half of providers who wrote prescriptions for opioids wrote six or less prescriptions to Medicaid patients over the year. The top prescribing provider wrote 6,539 prescriptions for opioids over the course of the year. This equates to about 25 prescriptions a day assuming a five day work week and 52 weeks in a year. 18
Average Number of Opioid Prescriptions Written by Each Provider to Medicaid Clients by Decile 600 574 500 400 Prescriptions 300 200 117 100 50 21 9 4 2 1 1 1 Median 0 Bottom Decile Second Decile Third Decile Fourth Decile Fifth Decile Providers Sixth Decile Seven Decile Eighth Decile Ninth Decile Top Decile 19
Number of Unique Medicaid Patients per Provider A unique Medicaid patient is any patient who sees a provider and receives a prescription for an opioid one or more times. Unique Medicaid patients may see one or more providers. The average provider will provide care to 36 unique Medicaid patients who received opioids. Half of providers will provide care to fewer than five unique Medicaid patients who will receive opioids. The top provider saw 2,191 unique Medicaid patients. This was a hospital. The top non-hospital provider saw 1,773 unique Medicaid patients. 20
Average Number of Unique Patients per Provider 250 241 Unique Medicaid Patients 200 150 100 65 50 28 13 6 3 1 1 1 1 Median 0 Bottom Decile Second Decile Third Decile Fourth Decile Fifth Decile Providers Sixth Decile Seven Decile Eighth Decile Ninth Decile Top Decile 21
Next Steps Expand analysis to include diagnosis codes when examining difference between total patient milligrams Analyze the difference in prescribing patterns of providers based on diagnoses, location, specialty, and credential. Individual provider prescribing pattern analysis. The DHCFP data warehouse is comprised of claims data submitted by over 15,000 Medicaid providers from within Nevada and across the country. While DHCFP staff conscientiously make their best efforts to validate this data through continuous provider education and the use of a highly experienced audit staff, the Division heavily relies on its providers to submit accurate and complete information on our Medicaid patients. It should therefore be understood by the users of DHCFP reports on disease morbidity and patient health that the data source for these reports is based solely on patient claims data and may not be a complete and comprehensive health record. 22
Opioid Equivalent Conversion Factor Sources Centers for Medicare & Medicaid Services https://www.cms.gov/Medicare/Prescription-Drug- Coverage/PrescriptionDrugCovContra/Downloads/Opioid- Morphine-EQ-Conversion-Factors-March-2015.pdf Medscape http://emedicine.medscape.com/article/2138678-overview Washington State Agency Medical Directors Group http://www.agencymeddirectors.wa.gov/Calculator/DoseCalcul ator.htm 23
Total Milligrams by Patient Characteristics Standard Error Standard Error Coefficient Coefficient Race Location Black -1,391.2 200.6 *** Washoe -1,865.4 204.8*** Hispanic -4,088.6 172.2 *** Rural -1,888.8 235.9*** Other -4,350.0 218.4 *** Out of State -3,877.9 395.6*** Age Gender 19 to 25 318.7 71.2 *** Male 257.5 160.8 26 to 34 3,181.1 23.6 *** 35 to 44 6,780.4 201.5*** Constant 3,005.5 167.5*** *** Significant at the 1% level 45 to 54 9,884.6 232.4*** 55 to 64 10,736.5 258.1*** Constant represents the average milligrams of morphine equivalent prescribed to a White, Female, Clark County Resident who is 0 to 18 years old over the course of a year. 65 to 74 9,555.8 499.8*** 75 to 84 4,558.5 421.0*** 85 and Older 2,396.9 352.9***