Accounting and Control in MBA Education
T
h
e
p
o
t
e
n
t
i
a
l
f
o
r
i
n
c
r
e
a
s
e
d
p
r
i
m
a
r
y
e
n
e
r
g
y
e
f
f
i
c
i
e
n
c
y
a
n
d
r
e
d
u
c
e
d
C
O
2
e
m
i
s
s
i
o
n
s
b
y
d
i
s
t
r
i
c
t
h
e
a
t
i
n
g
a
n
d
c
o
o
l
i
n
g
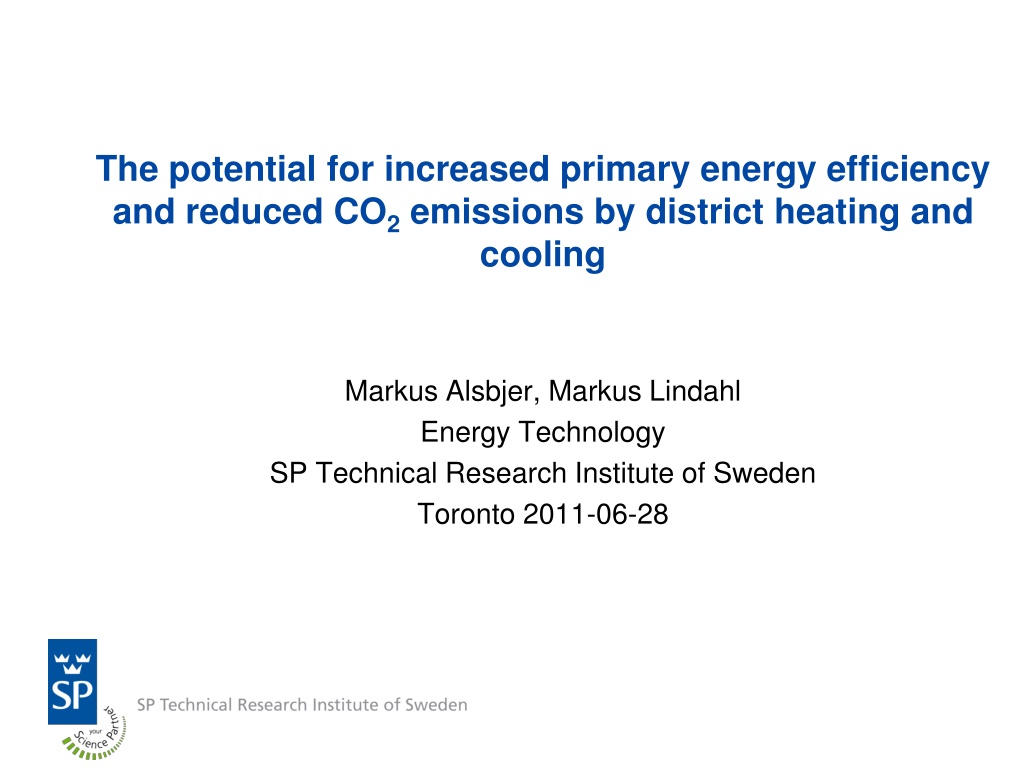
Markus Alsbjer, Markus Lindahl
Energy Technology
SP Technical Research Institute of Sweden
Toronto 2011-06-28
T
h
e
p
r
o
j
e
c
t
g
r
o
u
p
SP Technical Research Institute of Sweden,
Sweden
Project leader
KDHC - Korea District Heating Technology
Research Institute, South Korea
SINTEF Energy Research, Norway
B
a
c
k
g
r
o
u
n
d
t
o
t
h
e
p
r
o
j
e
c
t
A central standard for calculating the “energy performance” is EN
15603 where two main indicators are suggested:
–
Use of primary energy
–
Emissions of green house gases
The idea of the project is to develop a method which can be used to
calculate emissions of CO
2
-eq and PEF for relevant production
chains of district heating and cooling
Focus on combined heat and power (CHP) plants
A
i
m
a
n
d
o
b
j
e
c
t
i
v
e
Aim: To illustrate the environmental potential of saving primary energy
and reduce the impact on global warming by the use of district
heating and cooling
Objective: To develop a method for calculations of greenhouse gas
emissions and use of primary energy for the total production chain of
district heat and cold to buildings.
T
h
e
m
a
i
n
s
t
e
p
s
o
f
t
h
e
p
r
o
j
e
c
t
1.
Analyse actual process chains for district heating and cooling
2.
Analyse actual CHP plants
3.
Develop a method for calculating the environmental performance of
the district heating and cooling production chains
4.
Case studies
I
n
t
r
o
d
u
c
t
i
o
n
t
o
L
i
f
e
C
y
c
l
e
A
s
s
e
s
s
m
e
n
t
s
(
L
C
A
)
•
Calculates emissions and use of resources
from all parts of a products life cycle
–
Extraction of resources – Production –
Use – Waste handling
•
The principles for LCA calculations are
defined in the ISO standards 14040 and
14044
•
All emissions and use of resources are
related to the
functional unit
S
y
s
t
e
m
b
o
u
n
d
a
r
i
e
s
B
a
c
k
g
r
o
u
n
d
c
a
l
c
u
l
a
t
i
o
n
s
•
An Life Cycle Assessment (LCA) approach have been used
–
Including all parts of the life cycle until the heat/cold is delivered to
the building
•
The functional unit is 1 kWh of delivered heat or cold to the building
•
Included impact categories:
–
Global warming potential, GWP (g CO
2
-eqvivalents/kWh delivered
energy)
–
Primary Energy Factor, PEF (kWh primary energy/ kWh delivered
energy)
A
l
l
o
c
a
t
i
o
n
m
e
t
h
o
d
s
i
n
m
a
r
g
i
n
a
l
a
n
d
a
v
e
r
a
g
e
s
c
e
n
a
r
i
o
s
Two scenarios have been identified in this project:
•
Marginal scenario
–
Studying the effects of a change in the system
•
Average/bookkeeping scenario
–
Bookkeeping purposes or historical reporting
•
The allocation method describes how emissions and recourses are
shared between the heat and electricity in the CHP-plant
–
Depending on the scenario the choice of allocation methods will
differ
Electricity
Resources
District heating
Emissions
M
a
r
g
i
n
a
l
s
c
e
n
a
r
i
o
•
Often used for:
–
Studying the effects of a change in the system.
•
Typical questions for the marginal scenario:
–
What production will be affected if you turn out the light?
–
What will be the environmental effects of heating a new residential
area?
•
The marginal production is the technology/fuel that will be affected if
the consumption of heat or electricity is changed.
–
Normally the technology with the highest production cost
•
I
n
t
h
i
s
p
r
o
j
e
c
t
c
o
a
l
p
o
w
e
r
p
l
a
n
t
s
i
s
c
o
n
s
i
d
e
r
e
d
a
s
t
h
e
m
a
r
g
i
n
a
l
p
r
o
d
u
c
t
i
o
n
f
o
r
e
l
e
c
t
r
i
c
i
t
y
M
a
r
g
i
n
a
l
p
e
r
s
p
e
c
t
i
v
e
o
f
a
n
e
l
e
c
t
r
i
c
i
t
y
s
y
s
t
e
m
5 units elec
5 units elec
5 units elec
15 units elec
PE: 20 units
Sum PE: 60 units
PE: 20 units
PE: 20 units
3 units elec
PE: 10 units
4 units DH
2 units elec
PE: 8 units
S
u
m
P
E
:
5
8
u
n
i
t
s
4 units DH
Electricity system
(PE = Primary energy)
A
l
l
o
c
a
t
i
o
n
m
e
t
h
o
d
f
o
r
C
H
P
-
p
l
a
n
t
s
,
m
a
r
g
i
n
a
l
s
c
e
n
a
r
i
o
T
h
e
p
o
w
e
r
b
o
n
u
s
m
e
t
h
o
d
i
s
c
h
o
s
e
n
f
o
r
a
l
l
o
c
a
t
i
o
n
s
w
i
t
h
t
h
e
m
a
r
g
i
n
a
l
p
e
r
s
p
e
c
t
i
v
e
PE
heat
= PE
total_CHP
– PE
alt_elec_prod
PE
elec
= PE
alt_elec_prod
PE
heat
= 10 – (3*4) = -2 units
PE
elec
= 3*4 = 12 units
3 units elec
PE
total CHP
: 10 units
4 units DH
3 units elec
PE
alt
elec
prod
: 12 units
(PE = Primary energy)
A
v
e
r
a
g
e
/
B
o
o
k
k
e
e
p
i
n
g
s
c
e
n
a
r
i
o
Often used for:
•
Bookkeeping purposes
•
Historical reporting
Typical questions for the average scenario:
–
How much greenhouse gases has my consumption of district
heating caused this year?
–
How many percent of the greenhouse gas emission within EU are
related to the district heating sector?
A
l
l
o
c
a
t
i
o
n
m
e
t
h
o
d
,
a
v
e
r
a
g
e
s
c
e
n
a
r
i
o
•
T
h
e
a
l
t
e
r
n
a
t
i
v
e
g
e
n
e
r
a
t
i
o
n
m
e
t
h
o
d
i
s
c
h
o
s
e
n
f
o
r
a
l
l
o
c
a
t
i
o
n
s
w
i
t
h
t
h
e
a
v
e
r
a
g
e
p
e
r
s
p
e
c
t
i
v
e
•
Emissions and resources is allocated to the heat and power
production in proportion to the fuel needed to produce the same
amount of heat or power in two separate plants.
•
Both the heat and the power production benefits from the use of the
CHP process
3 units elec
PE
total CHP
: 10 units
4 units DH
Power bonus method
PE
elec
≈
6 units
(PE
elec
=
12 units)
PE
heat
≈
4 units
(PE
heat
=
-2 units)
C
o
m
p
u
t
e
r
s
i
m
u
l
a
t
i
o
n
s
Sensitivity analysis of CHP-plant related to the choice of:
–
Supply temperature
–
Return temperature
–
Power to heat ratio
Sensitivity analysis of ABS-chiller related to the choice of:
–
Supply temperature
–
Return temperature
C
o
m
p
u
t
e
r
s
i
m
u
l
a
t
i
o
n
s
o
f
n
a
t
u
r
a
l
g
a
s
C
H
P
-
p
l
a
n
t
-
H
e
a
t
a
n
d
P
o
w
e
r
e
f
f
i
c
i
e
n
c
y
a
s
a
f
u
n
c
t
i
o
n
o
f
t
h
e
s
u
p
p
l
y
t
e
m
p
e
r
a
t
u
r
e
C
a
s
e
s
t
u
d
i
e
s
•
Study the choice of allocation method
•
Study the choice of fuel
–
CHP-plants
–
Heat only plants
•
Study the dominance analyse of the production chain
•
Study the choice of size of the plant
•
Study district cooling with absorption chiller
G
r
e
e
n
h
o
u
s
e
g
a
s
e
m
i
s
s
i
o
n
s
-
D
e
p
e
n
d
i
n
g
o
n
f
u
e
l
,
p
r
o
d
u
c
t
i
o
n
t
e
c
h
n
o
l
o
g
y
a
n
d
a
l
l
o
c
a
t
i
o
n
m
e
t
h
o
d
U
s
e
o
f
p
r
i
m
a
r
y
e
n
e
r
g
y
-
D
e
p
e
n
d
i
n
g
o
n
f
u
e
l
,
p
r
o
d
u
c
t
i
o
n
t
e
c
h
n
o
l
o
g
y
a
n
d
a
l
l
o
c
a
t
i
o
n
m
e
t
h
o
d
G
r
e
e
n
h
o
u
s
e
g
a
s
e
m
i
s
s
i
o
n
s
-
D
o
m
i
n
a
n
c
e
a
n
a
l
y
s
e
d
i
s
t
r
i
c
t
h
e
a
t
i
n
g
,
A
v
e
r
a
g
e
s
c
e
n
a
r
i
o
G
r
e
e
n
h
o
u
s
e
g
a
s
e
m
i
s
s
i
o
n
s
-
D
o
m
i
n
a
n
c
e
a
n
a
l
y
s
e
d
i
s
t
r
i
c
t
h
e
a
t
i
n
g
,
A
v
e
r
a
g
e
s
c
e
n
a
r
i
o
M
a
i
n
c
o
n
c
l
u
s
i
o
n
s
•
A method for calculations of the “environmental performance” for the
production chain of DH/DC has been developed
•
The choice of allocation method has an enormous impact on the final
results
•
With a marginal scenario, natural gas is the best choice of fuel
•
With an average scenario waste or biomass is the best choice
•
The impact related to additives are significant to the final result
F
u
t
u
r
e
w
o
r
k
•
There is a need for better documented and more transparent data for
different energy chains.
•
Data for different fuels listed in EN 15603 are very general and might
give misleading values for DHC.
•
Calculations of PEF and CO
2
-eq including all parameters is time-
consuming. There is a need for a simplified method and/or a
computer based calculation tool that enables calculations for different
energy chains
•
The choice of allocation method has a great impact on the final result.
An analysis of additional allocation methods briefly described in this
project would be of interest.
Education to manage organizations, markets, and economy with data, contracts, and measurement processes. Explore interfaces between management, business, and society for effective decision-making and adaptation to changes in the environment. Learn about the importance of accounting and control systems in solving management problems and the consequences of failure in organizations, markets, and economy.

Download Presentation

Please find below an Image/Link to download the presentation.
The content on the website is provided AS IS for your information and personal use only. It may not be sold, licensed, or shared on other websites without obtaining consent from the author.If you encounter any issues during the download, it is possible that the publisher has removed the file from their server.
You are allowed to download the files provided on this website for personal or commercial use, subject to the condition that they are used lawfully. All files are the property of their respective owners.
The content on the website is provided AS IS for your information and personal use only. It may not be sold, licensed, or shared on other websites without obtaining consent from the author.
E N D
Presentation Transcript
The potential for increased primary energy efficiency and reduced CO2emissions by district heating and cooling Markus Alsbjer, Markus Lindahl Energy Technology SP Technical Research Institute of Sweden Toronto 2011-06-28
The project group SP Technical Research Institute of Sweden, Sweden Project leader KDHC - Korea District Heating Technology Research Institute, South Korea SINTEF Energy Research, Norway
Background to the project A central standard for calculating the energy performance is EN 15603 where two main indicators are suggested: Use of primary energy Emissions of green house gases The idea of the project is to develop a method which can be used to calculate emissions of CO2-eq and PEF for relevant production chains of district heating and cooling Focus on combined heat and power (CHP) plants
Aim and objective Aim: To illustrate the environmental potential of saving primary energy and reduce the impact on global warming by the use of district heating and cooling Objective: To develop a method for calculations of greenhouse gas emissions and use of primary energy for the total production chain of district heat and cold to buildings.
The main steps of the project 1. Analyse actual process chains for district heating and cooling 2. Analyse actual CHP plants 3. Develop a method for calculating the environmental performance of the district heating and cooling production chains 4. Case studies
Introduction to Life Cycle Assessments (LCA) Calculates emissions and use of resources from all parts of a products life cycle Extraction of resources Production Use Waste handling The principles for LCA calculations are defined in the ISO standards 14040 and 14044 All emissions and use of resources are related to the functional unit
System boundaries Power grid Elec. (pumps) Elec. Construction and dismantling Construction and dismantling Additives District cooling net ABS chiller District heating net Fuel Combustion plant Building handling Construction and dismantling Construction and dismantling Elec. (pumps) Ashes
Background calculations An Life Cycle Assessment (LCA) approach have been used Including all parts of the life cycle until the heat/cold is delivered to the building The functional unit is 1 kWh of delivered heat or cold to the building Included impact categories: Global warming potential, GWP (g CO2-eqvivalents/kWh delivered energy) Primary Energy Factor, PEF (kWh primary energy/ kWh delivered energy)
Allocation methods in marginal and average scenarios Two scenarios have been identified in this project: Marginal scenario Studying the effects of a change in the system Average/bookkeeping scenario Bookkeeping purposes or historical reporting The allocation method describes how emissions and recourses are shared between the heat and electricity in the CHP-plant Depending on the scenario the choice of allocation methods will differ Emissions Electricity District heating Resources
Marginal scenario Often used for: Studying the effects of a change in the system. Typical questions for the marginal scenario: What production will be affected if you turn out the light? What will be the environmental effects of heating a new residential area? The marginal production is the technology/fuel that will be affected if the consumption of heat or electricity is changed. Normally the technology with the highest production cost In this project coal power plants is considered as the marginal production for electricity
Marginal perspective of an electricity system Electricity system 3 units elec 4 units DH PE: 10 units PE: 20 units 5 units elec 15 units elec 4 units DH PE: 20 units 5 units elec PE: 20 units PE: 8 units 5 units elec 2 units elec Sum PE: 60 units Sum PE: 58 units (PE = Primary energy)
Allocation method for CHP-plants, marginal scenario The power bonus method is chosen for allocations with the marginal perspective PEheat= PEtotal_CHP PEalt_elec_prod PEelec= PEalt_elec_prod 3 units elec 4 units DH PEtotal CHP: 10 units 3 units elec PEalt elec prod: 12 units PEheat= 10 (3*4) = -2 units PEelec= 3*4 = 12 units (PE = Primary energy)
Average/Bookkeeping scenario Often used for: Bookkeeping purposes Historical reporting Typical questions for the average scenario: How much greenhouse gases has my consumption of district heating caused this year? How many percent of the greenhouse gas emission within EU are related to the district heating sector?
Allocation method, average scenario The alternative generation method is chosen for allocations with the average perspective Emissions and resources is allocated to the heat and power production in proportion to the fuel needed to produce the same amount of heat or power in two separate plants. Both the heat and the power production benefits from the use of the CHP process 3 units elec 4 units DH PEtotal CHP: 10 units Power bonus method (PEelec= 12 units) (PEheat= -2 units) PEelec 6 units PEheat 4 units
Computer simulations Sensitivity analysis of CHP-plant related to the choice of: Supply temperature Return temperature Power to heat ratio Ambient Temperature(T0) Fuel(NG) Gen Gas Turbine Air Electricity Flue Gas Flue Gas Steam Turbine(HP) Steam Turbine(LP) Gen HRSG Stack Electricity DH supply(T2) DH Return(T1) Heat Exchanger (District Heating) Condenser Cooling Tower Sensitivity analysis of ABS-chiller related to the choice of: Supply temperature Return temperature Vapour 95 36 Cooling Water DH Water Heating Cooling 80 Concentrated LiBr Solution H/E Vapour 8 Chilled Water Cooling 31 Cooling Water 13 Dilute LiBr Solution Water
Computer simulations of natural gas CHP-plant - Heat and Power efficiency as a function of the supply temperature 55% 50% Efficiency Power efficiency Heat efficiency 45% 40% 80 90 105 115 120 DH Supply temp ( C)
Power grid Case studies Additives Study the choice of allocation method Combustion plant Fuel Heat Study the choice of fuel CHP-plants Heat only plants Construction and dismantling Losses Ashes Study the dominance analyse of the production chain Study the choice of size of the plant Elec. (operation) Study district cooling with absorption chiller Construction and dismantling ABS chiller Coldprod Heat Losses
Greenhouse gas emissions - Depending on fuel, production technology and allocation method Waste (70% renewable) Fuel oil 2-5 Natural gas Biomass 600 400 g CO2-eq / kWh heat 200 0 -200 -400 -600 -800 Heat only CHP, Power bonus CHP, Alternative Generation method
Use of primary energy - Depending on fuel, production technology and allocation method Waste (70% renewable) Fuel oil 2-5 Natural gas Biomass 2,0 1,5 1,0 kWh / kWh heat 0,5 0,0 -0,5 -1,0 -1,5 Heat only CHP, Power bonus CHP, Alternative Generation method
Greenhouse gas emissions - Dominance analyse district heating, Average scenario 350 300 Fuel oil 2-5 250 g CO2-eq/kWh heat 200 Natural gas 150 Waste (70% renewable) 100 Biomass 50 0
Greenhouse gas emissions - Dominance analyse district heating, Average scenario Natural gas Biomass Fuel handling Combustion Additives Ashes C&D CHP plant C&D DH-net Elec pumps DH net
Main conclusions A method for calculations of the environmental performance for the production chain of DH/DC has been developed The choice of allocation method has an enormous impact on the final results With a marginal scenario, natural gas is the best choice of fuel With an average scenario waste or biomass is the best choice The impact related to additives are significant to the final result
Future work There is a need for better documented and more transparent data for different energy chains. Data for different fuels listed in EN 15603 are very general and might give misleading values for DHC. Calculations of PEF and CO2-eq including all parameters is time- consuming. There is a need for a simplified method and/or a computer based calculation tool that enables calculations for different energy chains The choice of allocation method has a great impact on the final result. An analysis of additional allocation methods briefly described in this project would be of interest.


")