Access to Quality Teaching: Myths, Facts, and Policy Solutions
The presentation delves into the crucial role of teachers in student success, debunking myths, discussing performance indicators, and analyzing international and state comparisons. It emphasizes the necessity of teacher accountability and the impact on student outcomes.
Uploaded on Sep 18, 2024 | 0 Views
Download Presentation

Please find below an Image/Link to download the presentation.
The content on the website is provided AS IS for your information and personal use only. It may not be sold, licensed, or shared on other websites without obtaining consent from the author.If you encounter any issues during the download, it is possible that the publisher has removed the file from their server.
You are allowed to download the files provided on this website for personal or commercial use, subject to the condition that they are used lawfully. All files are the property of their respective owners.
The content on the website is provided AS IS for your information and personal use only. It may not be sold, licensed, or shared on other websites without obtaining consent from the author.
E N D
Presentation Transcript
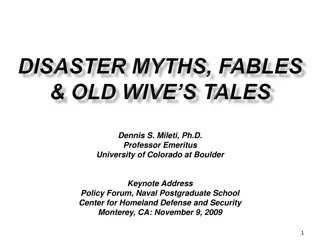
Access to Quality Teaching: Myths, Facts, and Potential Policy Solutions for the Future Dr. Michael Hansen Senior Fellow and Director, Brown Center on Education Policy Brookings Institution September 29th, 2016
1 From the moment students enter a school, the most important factor in their success is not the color of their skin or the income of their parents, it s the person standing at the front of the classroom... America s future depends on its teachers. President Barack Obama, Remarks to the Hispanic Chamber of Commerce, March 10, 2009
2 Overview: a. Performance and accountability b. Three myths about teachers and schools c. Strategies for moving forward
3 International Comparisons: In TIMSS, U.S. fourth graders scored 541 in math, near the middle of second-tier countries on TIMSS (ranked 11 of 50 countries) Eighth graders scored 509 in math. Which is barely (but significantly) higher than the 500 international average Eighth graders scored 525 in science, significantly above the international average and significantly below students from eight other nations In PISA test, among the 34 OECD countries, the U.S. performed below average in mathematics in 2012 and is ranked 27th In reading and science the U.S. performed close to the OECD average. The U.S. ranks 17 in reading, and 20 in science Source: Tom Loveless, The latest TIMSS and PIRLS scores. Retrieved from https://www.brookings.edu/research/the-latest-timss- and-pirls-scores/ Country nore, OECD Results from PISA 2012 https://www.oecd.org/unitedstates/PISA-2012-results-US.pdf
4 State Comparisons: 2013 NAEP ranking (out of 51) Adjusted ranking Change in ranking Spending per student Arizona 41 40 1 $7,667 Colorado 9 12 -3 $8,893 Idaho 25 43 -18 $6,916 Nevada 43 33 10 $8,211 New Mexico 50 36 14 $9,375 Utah 24 47 -23 $6,580 Source: Chingos, M. (2015) Breaking the curve. Promises and pitfalls of Using NAEP data to assess the state role in student achievement. Table A.1 and Common Core of Data (CCD) 2012-2013
5 Increasing accountability a. NCLB s role b. Part of a general accountability push c. Consequence of greater data availability d. Accountability is here to stay
6 Accountability comes to teachers a. Natural extension of school-based accountability b. Teachers matter a great deal to students c. Race to the Top, NCLB prompt flood of legislation on teacher evaluation
7 Public opinion on teachers accountability Source: Peterson, P., Henderson, M., West, M. and Barrows, S. (2016) Ten-year Trends in Public Opinion From the EdNext Poll. Retrieved from http://educationnext.org/ten-year-trends-in-public-opinion-from-ednext-poll-2016-survey/
8 Teachers attitudes towards teacher evaluation 2% 7% 16% 24% 44% 60% 63% 59% 93% 56% 38% 21% 17% Total Never evaluated Evaluated once every few years Evaluated once a year Evaluated more than once a year Think they should be evaluated less often Think they are evaluated as often as they should often Think they should be evaluated more often
9 Three myths about teachers and schools a. The most affluent districts have the best schools b. We know what good teaching is and how to screen for the best teachers c. The most affluent schools have the best teachers
10 Myth 1: The most affluent districts have the best schools a. Proficiency measures versus progress on proficiency measures b. Misattribution problem c. Fact check: good schools exist in all types of neighborhoods
11 Level of poverty and school performance Source: Mark Ehlert, Cory Koedel, Eric Parsons and Michael Podgursky Choosing the right growth, http://educationnext.org/choosing-the-right-growth-measure/
12 Myth 2: We know what good teaching is and how to screen for the best teachers a. Teacher qualifications versus teacher quality b. Measuring teacher quality c. Purposes of evaluation
13 Identifying teacher quality Inputs Process-based measures Outcomes Licensure / Certification Observational ratings Student test scores Education Peer review SLOs Experience Student surveys Student surveys Professional development Student non-test outcomes
14 14 Myth 3: The most affluent schools have the best teachers a. Misattribution problem once again b. Yet, based in empirical findings c. Fact check: great teachers exist in all types of schools d. Implications for desegregation proposals
15 Access to Quality Teaching Source: Mark Ehlert, Cory Koedel, Eric Parsons and Michael Podgursky Choosing the right growth, http://educationnext.org/choosing-the-right-growth-measure/
16 Strategies for moving forward a. Less direct, more indirect i. Using evaluations to help teachers improve ii. Using performance data to staff teachers in non- traditional ways b. Maybe we have our own misattribution problem i. Teachers in a school context ii. The value of curriculum
