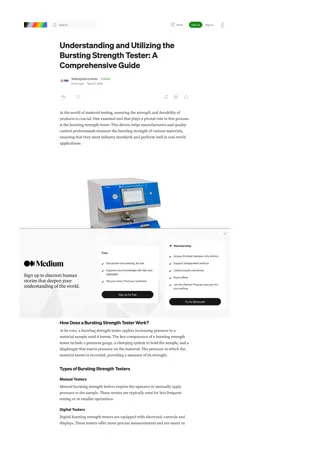
Understanding and Utilizing the Bursting Strength Tester: A Comprehensive Guide
In the world of material testing, ensuring the strength and durability of products is crucial. One essential tool that plays a pivotal role in this process is the bursting strength tester. This device helps manufacturers and quality control professionals measure the bursting strength of various mate
6 views • 5 slides
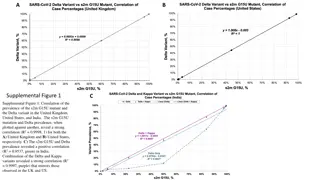
Correlation of s2m G15U Mutant and Delta Variant Prevalence
The correlation between the prevalence of the s2m G15U mutant and the Delta variant in the UK, US, and India was analyzed, showing strong correlations in the UK and US, and a positive correlation in India. Analysis of the s2m phenotype in the Alpha, Delta, and Kappa variants was also conducted. Addi
3 views • 4 slides
Understanding Correlation Analysis in Statistics
Exploring the concept of correlation in statistics: from measuring the strength of linear relationships between variables to interpreting correlation coefficients and coefficients of determination. A practical example involving bass drum sales and TV appearances by a popular group illustrates how co
0 views • 23 slides
Understanding Correlation in Two-Variable Data Analysis
This content discusses calculating the correlation between two quantitative variables, its properties, and how outliers can influence the correlation. It provides a step-by-step guide on how to calculate the correlation coefficient 'r' using z-scores. Additionally, it presents a practical problem of
0 views • 18 slides
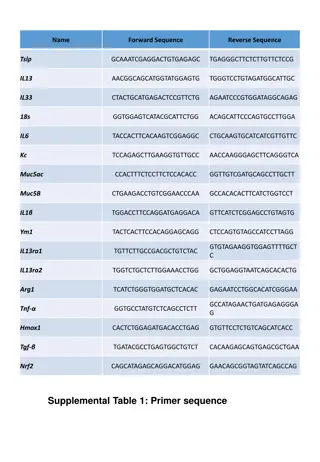
Molecular Biology Study: Primer Sequences and Correlation Analyses
This study delves into the realm of molecular biology, focusing on primer sequences for various genes like IL13, IL33, Muc5ac, and more. Additionally, it explores PCA analyses of different study groups and correlation of variables using Pearson correlation coefficient. The research sheds light on th
0 views • 4 slides
Understanding Correlation and Causation in Data Analysis
A correlation analysis assesses the relationship strength and direction between two variables using the Pearson correlation coefficient. It's crucial to differentiate between correlation and causation, where correlation indicates a relationship but not causation. Exploring examples like ice cream sa
0 views • 13 slides
Understanding Simple Linear Correlation in Commerce: Lecture Compilation by Dr. Parminder Kaur
Correlation analysis is essential in understanding the co-variation between two or more variables. This lecture compiled by Dr. Parminder Kaur, an Assistant Professor in the Department of Commerce, delves into the definition of correlation, types of correlation such as positive/negative, simple/part
0 views • 12 slides
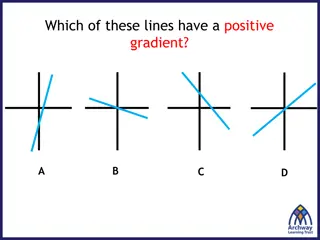
Understanding Scatter Plots and Correlation in Data Analysis
Scatter plots display relationships between two sets of data, while correlation describes the type of relationship. The line of best fit in a scatter plot helps in visualizing patterns. Examples illustrate positive, negative, and no correlation scenarios. Learning to interpret scatter plots aids in
4 views • 11 slides
Understanding Correlation in Two-Variable Data Analysis
Exploring the concept of correlation in analyzing two-variable data, this lesson delves into estimating the correlation between quantitative variables, interpreting the correlation, and distinguishing between correlation and causation. Through scatterplots and examples, the strength and direction of
0 views • 13 slides
Understanding Pharmaceutical Preparations: Strength and Concentration
Pharmaceutical preparations can have their strength and concentration adjusted by changing the proportion of active ingredients. This process involves increasing or decreasing the active ingredient, adding diluents, admixing with other preparations, or evaporating the vehicle. Dilution of liquid, so
0 views • 34 slides
Understanding Correlation in Research Designs
Research designs like experimental, quasi-experimental, and correlational serve different purposes in studying variable relationships. Correlation does not imply causation and can be positive or negative, indicating how two variables change together. The correlation coefficient quantifies this relat
5 views • 43 slides
Understanding Correlation and Regression in Data Analysis
Correlation and Regression play vital roles in investigating relationships between quantitative variables. Pearson's r correlation coefficient measures the strength of association between variables, whether positive or negative, linear or non-linear. Learn about different types of correlation, such
0 views • 26 slides
Understanding Correlational Research in Psychology
Correlational research in psychology focuses on determining the degree of relationship between variables without manipulation. It helps show the magnitude of association but not causation. Correlation coefficient indicates the existence, degree, and direction of the relationship between variables. P
0 views • 38 slides
Understanding Rock Correlation Through Facies and Biostratigraphy
Explore the correlation of rocks using facies and biostratigraphy in Activity 3 of EOSC 326. Learn about constructing biozones, correlating stratigraphic logs, and interpreting paleoenvironments. Discover the significance of fossils B and F in correlation and apply techniques like seriation in const
5 views • 19 slides
Understanding Scatter Diagram Method for Correlation Analysis
Scatter Diagram Method is a simple and effective way to study the correlation between two variables. By plotting data points on a graph, it helps determine the degree of correlation between the variables. Perfect positive and negative correlations, as well as high and low degrees of correlation, can
0 views • 11 slides
Applications of Regression and Correlation Analysis in Business
Regression and correlation analysis play vital roles in business, helping to quantify relationships between variables. Regression analysis estimates relationships between dependent and independent variables, while correlation analysis quantifies associations between continuous variables. These techn
0 views • 9 slides
Understanding Pearson Product-Moment Correlation Coefficient
Pearson product-moment correlation coefficient, denoted by "r," is a numerical measure of the strength and direction of a linear relationship between two variables. It ranges from -1 to +1, where 1 signifies a perfect positive linear correlation, -1 a perfect negative linear correlation, and 0 no co
0 views • 18 slides
Understanding Multicollinearity in Regression Analysis
Multicollinearity in regression analysis can be assessed using various tests such as Variable Inflation Factors (VIF) and R^2 value. VIF measures the strength of correlation between independent variables, while an R^2 value close to 1 indicates high multicollinearity. The Farrar Glauber test and con
0 views • 6 slides
Understanding Correlation in Quantitative Variables
Explanation of how to calculate correlation between two quantitative variables, the importance of outliers in correlation, and the impact of strength and direction on the correlation coefficient.
0 views • 26 slides
Understanding Electronic Excitation in Semiconductor Nanoparticles from a Real-Space Quasiparticle Perspective
This research delves into the electronic excitation in semiconductor nanoparticles, focusing on real-space quasiparticle perspectives. It explores treating electron correlation using explicit operators, leading to faster algorithms while calculating optical gap and exciton binding energies. Various
0 views • 45 slides
Understanding Correlation and Covariance in Business Analytics
Explore the concepts of covariance and correlation in business analytics to understand the relationship between random variables. Delve into how these measures help analyze dependence between variables, differentiate between independence and covariance, and interpret correlation as a dimensionless m
4 views • 27 slides
Contribution of Quadriceps, Hamstrings, and Latissimus Dorsi Muscle Strength to Rowing Performance in West Java
Rowing is a demanding sport that requires strong leg muscle strength for optimal performance, particularly in West Java where rowing athletes train. This study aims to investigate the contribution of quadriceps, hamstrings, and latissimus dorsi muscle strength to the performance of rowing athletes i
0 views • 16 slides
Impact of Correlation on Human Reliability Analysis
Understanding the impact of correlation between Performance Shaping Factors (PSFs) on their multipliers in the context of Human Reliability Analysis (HRA), particularly focusing on the SPAR-H method. The correlation among PSFs, such as stress, complexity, and training, is evaluated to determine how
1 views • 25 slides
Addressing Skew and Lack of Correlation in Teacher Observation and Student Growth Data
Review the data analysis process to identify root causes of lack of correlation, develop a District Data Action Plan, and follow an Application and Approval Timeline. Receive Technical Assistance to utilize data effectively, analyze potential issues affecting student achievement, and ensure teacher
0 views • 38 slides
Statistical Correlation Between Grip and Core Strength in Healthy Adults Aged 40-79
Investigating the relationship between grip and core strength in healthy individuals aged 40 to 79, Fiona Bischofberger and Selina Papritz from Zurich University of Applied Sciences conducted a study to determine any statistical correlation. The research aims to provide insights into the connection
0 views • 6 slides
Understanding Correlation Coefficient and Line of Best Fit
Learn how to find the correlation coefficient and create a line of best fit using statistical and regression calculations. Discover the steps involved, from setting up the calculator to analyzing the input data and determining the correlation between variables.
0 views • 14 slides
Understanding Measures of Linear Relationship in Statistics
Exploring the concepts of covariance and correlation coefficient in statistics to determine the strength and direction of linear relationships between variables. Covariance indicates the pattern two variables move together, while correlation coefficient quantifies the strength of the relationship. S
0 views • 35 slides
Exact Correlation Models in Biscalar Fishnet Theory
In the study of biscalar fishnet models, various operators and spectra were explored, leading to findings on exact correlation functions, strong coupling regimes, Regge limits, and more in arbitrary dimensions. The investigation delves into Lagrangian formulations, graph-building operators, conforma
0 views • 15 slides
Understanding Correlation in Scatter Graphs
In this content, various graphs are used to demonstrate the concept of correlation in scatter graphs. It discusses positive, negative, and no correlation, showcasing how one variable affects the other. Examples and explanations are provided to help understand the relationships between different sets
0 views • 17 slides
Understanding Correlation in Economics and Education
Correlation in education refers to the technique of establishing reciprocal relationships between different subjects to enhance understanding. The etymological meaning of correlation stems from Latin roots, signifying interlinking. Various types of correlation such as vertical and horizontal correla
0 views • 33 slides
Total Body Push Pull Rotate Training for Strength and Endurance
Total Body Push Pull Rotate Training helps improve muscular endurance and strength by alternating exercises from different strength training categories. The workout consists of choosing exercises from push/pull categories and incorporating rotational movements for a comprehensive full-body workout.
0 views • 5 slides
Enhancing NEXRAD's Dual-Polarization Upgrade for Improved Correlation Coefficients
Enhance the value of NEXRAD's dual-polarization upgrade by improving the quality of correlation coefficients, particularly focusing on the usability and accuracy of | ρ hv (0)| for radar return classification. Addressing issues with correlation coefficient estimates exceeding one is crucial for val
0 views • 6 slides
Statistical Analysis: Correlation and Regression Study by Dr. Said T. El Hajjar
In the second semester of 2017 at Ahlia University, Dr. Said T. El Hajjar presented a study focusing on correlation and regression analysis. The study investigated the relationship between independent variables PP and SS with the dependent variable TP. Through various case scenarios, the study revea
0 views • 18 slides
Understanding Correlation Strength in Data Representation
Explore different types of correlations in data representation through various examples. Learn to identify positive, negative, or no correlation, and determine the strength - whether weak, moderate, or strong. Visualize correlations through graphs and understand the implications for data analysis an
0 views • 17 slides
Understanding Correlation and Regression in Statistical Analysis
Exploring the concepts of correlation, regression, and hypothesis testing in statistical analysis to assess relationships between variables, determine effect sizes, and interpret results. Key topics include z-scores, comparing means, and the general requirements for applying correlation analysis.
0 views • 36 slides
Correlation Clustering: Near-Optimal LP Rounding and Approximation Algorithms
Explore correlation clustering, a powerful clustering method using qualitative similarities. Learn about LP rounding techniques, approximation algorithms, NP-hardness, and practical applications like document deduplication. Discover insights from leading researchers and tutorials on theory and pract
0 views • 27 slides
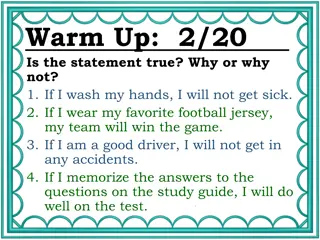
Understanding Correlation and Causation
Explore the concepts of correlation and causation through various scenarios such as handwashing and sickness, wearing a favorite football jersey and winning games, or memorizing study guides for tests. Distinguish between correlation and causation with thought-provoking examples like ice cream sales
0 views • 14 slides
Understanding Smoothing, Correlation, and Spectra in Environmental Data Analysis
Explore the interrelationships between smoothing, correlation, and power spectral density in environmental data analysis through topics like autocorrelation, cross-correlation, Fourier series, and more. Learn how to apply these concepts using MatLab for effective data analysis.
0 views • 81 slides
Understanding Correlation in Statistics
This lesson delves into calculating the correlation between two quantitative variables, exploring properties of correlation, addressing how outliers affect correlation values, and more. You will learn the steps to calculate correlation, understand its properties, and the importance of variable type
0 views • 10 slides
Understanding Concrete Strength in Structural Design
Concrete strength, including compressive, tensile, and flexural strengths, plays a crucial role in structural design. Compressive strength is the main quality criterion, while tensile strength is lower due to concrete's brittleness. Flexural strength also impacts the behavior of structural members.
0 views • 17 slides
