Analyzing Two-Variable Data in Statistics and Probability
This content delves into analyzing relationships between two quantitative variables in statistics and probability, focusing on distinguishing between explanatory and response variables, creating scatterplots, and interpreting the strength and form of relationships displayed. It emphasizes the import
0 views • 14 slides
Regression Analysis in Social Sciences
Explore a practical regression example involving sales productivity evaluation in a software company. Learn how to draw scatterplots, estimate correlations, and determine significant relationships between sales calls and systems sold. Discover the process of predicting sales using regression analysi
2 views • 35 slides
Correlation in Two-Variable Data Analysis
Exploring the concept of correlation in analyzing two-variable data, this lesson delves into estimating the correlation between quantitative variables, interpreting the correlation, and distinguishing between correlation and causation. Through scatterplots and examples, the strength and direction of
0 views • 13 slides

Exploratory Data Analysis and Descriptive Statistics in Statistical Analysis
Exploratory Data Analysis involves understanding data characteristics through visualization techniques like bar graphs, pie charts for qualitative data and histograms, scatterplots for quantitative data. It includes calculating mean, median for center, range, standard deviation for spread, and ident
2 views • 7 slides
Correlation and Regression in Data Analysis
Correlation and Regression play vital roles in investigating relationships between quantitative variables. Pearson's r correlation coefficient measures the strength of association between variables, whether positive or negative, linear or non-linear. Learn about different types of correlation, such
0 views • 26 slides

Arctic Sea Ice Regression Modeling & Rate of Decline
Explore the rate of decline of Arctic sea ice through regression modeling techniques. The presentation covers variables, linear regression, interpretation of scatterplots and residual plots, quadratic regression, and the comparison of models. Discover the decreasing trend in Arctic sea ice extent si
1 views • 9 slides
Correlation Coefficients in Data Analysis
Learn how correlation coefficients can be used to make sense of scatter in linear associations. Explore examples of analyzing height and shoe size data, unusual datasets, scatterplots, and regression equations to understand the variability and predictability in different scenarios.
0 views • 8 slides

Interactive Data Visualization Tools and Techniques Quiz
This quiz tests knowledge on data visualization tools, techniques, and concepts. Questions cover topics such as the use of EDA in data visualization, interactive graph outputs, historical figures in data visualization, GIS data types in SAS/JMP, outlier detection in 3D scatterplots, and limitations
1 views • 11 slides
Regression Analysis in Data Science
Explore the principles of regression analysis in data science, focusing on bivariate regression and linear models. Learn how to write the equation of a line to describe relationships between variables and assess the goodness of fit using scatterplots, correlation coefficients, determination coeffici
0 views • 29 slides
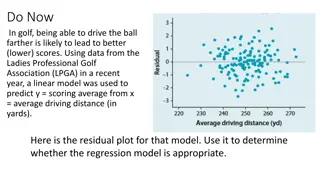
Analyzing Residual Plots for Regression Model Appropriateness in Golf
Utilizing residual plots to evaluate the appropriateness of a linear regression model predicting scoring average from average driving distance in golf based on LPGA data. Introduction to quadratic and exponential models, with an example exploring the relationship between braking distance for motorcy
0 views • 15 slides
Cognitive Modeling in Learning Sciences
Cognitive modeling is a key aspect of simulating human problem-solving and mental processes in computerized models. It involves the use of various types of cognitive models, such as production-rule systems and constraint-based models, to predict human behavior and performance on tasks. This field en
0 views • 83 slides

Insights into Eye Color Phenotypes and Probabilities
Understanding eye color phenotypes and probabilities through visual analysis of data from Ireland, Greece, and Poland. Utilizing programming techniques to create colorized scatterplots, frequency tables, and probability lists. Observations reveal how high probabilities of certain eye colors translat
33 views • 7 slides