Correlation Analysis in Statistics
Exploring the concept of correlation in statistics: from measuring the strength of linear relationships between variables to interpreting correlation coefficients and coefficients of determination. A practical example involving bass drum sales and TV appearances by a popular group illustrates how co
4 views • 23 slides
Correlation in Two-Variable Data Analysis
This content discusses calculating the correlation between two quantitative variables, its properties, and how outliers can influence the correlation. It provides a step-by-step guide on how to calculate the correlation coefficient 'r' using z-scores. Additionally, it presents a practical problem of
3 views • 18 slides
Correlation and Causation in Data Analysis
A correlation analysis assesses the relationship strength and direction between two variables using the Pearson correlation coefficient. It's crucial to differentiate between correlation and causation, where correlation indicates a relationship but not causation. Exploring examples like ice cream sa
3 views • 13 slides
Simple Linear Correlation in Commerce: Lecture Compilation by Dr. Parminder Kaur
Correlation analysis is essential in understanding the co-variation between two or more variables. This lecture compiled by Dr. Parminder Kaur, an Assistant Professor in the Department of Commerce, delves into the definition of correlation, types of correlation such as positive/negative, simple/part
2 views • 12 slides
Correlation in Two-Variable Data Analysis
Exploring the concept of correlation in analyzing two-variable data, this lesson delves into estimating the correlation between quantitative variables, interpreting the correlation, and distinguishing between correlation and causation. Through scatterplots and examples, the strength and direction of
2 views • 13 slides
Price-Output Determination Under Low-Cost Price Leadership
Economists have developed models on price-output determination under price leadership, with assumptions about leader and follower behavior. In this scenario, two firms, A and B, with equal market share and homogeneous products, navigate pricing strategies based on cost differentials. Firm A, with lo
2 views • 7 slides
Correlation and Regression in Data Analysis
Correlation and Regression play vital roles in investigating relationships between quantitative variables. Pearson's r correlation coefficient measures the strength of association between variables, whether positive or negative, linear or non-linear. Learn about different types of correlation, such
5 views • 26 slides
Scatter Diagram Method for Correlation Analysis
Scatter Diagram Method is a simple and effective way to study the correlation between two variables. By plotting data points on a graph, it helps determine the degree of correlation between the variables. Perfect positive and negative correlations, as well as high and low degrees of correlation, can
1 views • 11 slides
Pearson Product-Moment Correlation Coefficient
Pearson product-moment correlation coefficient, denoted by "r," is a numerical measure of the strength and direction of a linear relationship between two variables. It ranges from -1 to +1, where 1 signifies a perfect positive linear correlation, -1 a perfect negative linear correlation, and 0 no co
4 views • 18 slides
Weighted Price Indices in Economics
Weighted price indices are essential in economics to measure changes in prices over time. Different methods such as Laspeyre's and Paasche's price indices offer ways to calculate these indices using weighted averages. Fisher's index combines both methods to provide a comprehensive view. The weighted
17 views • 9 slides
Correlation in Quantitative Variables
Explanation of how to calculate correlation between two quantitative variables, the importance of outliers in correlation, and the impact of strength and direction on the correlation coefficient.
5 views • 26 slides
Price Index: Issues and Concepts
Price indices play a crucial role in measuring changes in prices of goods and services. This presentation covers the construction of price indices, defining purposes, selecting base periods, assigning weights, and more. Explore the purpose, scope, and coverage of price indices as measures of inflati
2 views • 32 slides
Correlation in Economics and Education
Correlation in education refers to the technique of establishing reciprocal relationships between different subjects to enhance understanding. The etymological meaning of correlation stems from Latin roots, signifying interlinking. Various types of correlation such as vertical and horizontal correla
1 views • 33 slides
Constructing Price Index: General Procedure and Aggregation
The process of constructing a price index involves various steps such as computation of price relatives, aggregation at different levels, selection of base period, and designing data collection methods. Weighted arithmetic mean and simple ratio calculations are used in aggregating price indices. A t
5 views • 31 slides
Elasticity in Economics
Elasticity in economics refers to the responsiveness of demand to price changes. A more elastic curve results in larger quantity changes for small price changes, while a less elastic curve requires larger price changes to affect quantity consumed. The elasticity of demand can be measured by calculat
6 views • 13 slides
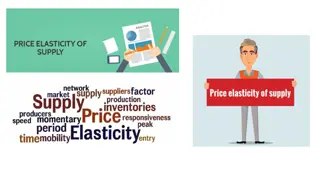
Price Elasticity of Supply in Economics
Price elasticity of supply measures how much the quantity supplied responds to changes in price. It can be inelastic (quantity supplied responds slightly), elastic (quantity supplied responds substantially), or unit-elastic (price elasticity of supply equals 1). Various determinants like the passage
3 views • 16 slides
Degrees of Elasticity of Demand
Elasticity of demand refers to the responsiveness of quantity demanded to changes in price. Perfectly elastic demand occurs when there is an infinite demand at a particular price and demand becomes zero with a slight rise in price. Conversely, perfectly inelastic demand occurs when there is no chang
5 views • 11 slides
Price Discrimination in Monopoly Markets
Price discrimination under monopoly occurs when businesses charge different prices to different consumer groups for the same product or service. Conditions for price discrimination include monopoly power, market segmentation, ability to separate consumer groups, and prevention of resale. Examples of
7 views • 12 slides
Correlation in Statistics
This lesson delves into calculating the correlation between two quantitative variables, exploring properties of correlation, addressing how outliers affect correlation values, and more. You will learn the steps to calculate correlation, understand its properties, and the importance of variable type
2 views • 10 slides
Government Price Controls & Supports
Types of government price controls include price ceilings, price floors, and price supports, with a focus on agricultural products. Price supports ensure income guarantees for farmers by setting minimum prices and purchasing excess supply. The effects of price supports can impact welfare, with consu
0 views • 27 slides
Alternative Theories of Pricing Behavior
Two alternative theories - the Kinked Demand Curve Theory and Price Leadership - explain pricing behavior in oligopolistic markets. The Kinked Demand Curve Theory suggests that firms in an oligopoly tend to respond aggressively to price cuts but ignore price increases, leading to a stable price. On
3 views • 24 slides
Correlation in Data Analysis
This content discusses how scatter graphs represent data relationships, interpreting correlations, and distinguishing causation from correlation. Learn about positive, negative, and no correlation through practical examples like city population studies and salary-age comparison. Dive into the basics
3 views • 17 slides
Economic Parameters of Mergers and Acquisitions Analysis
This review delves into various quantitative methods and analysis techniques used to assess the economic impact of mergers and acquisitions, including price correlation, price elasticity, price/concentration analysis, natural experiments/shock analysis, and critical loss analysis. Case studies such
1 views • 18 slides
Analyzing Two-Variable Data
This lesson explores correlation in two-variable data, emphasizing the strength and direction of a linear relationship using the correlation coefficient. It discusses how to interpret correlations, differentiate between correlation and causation, and highlights the limitations of correlation analysi
1 views • 8 slides
Regression, Correlation, and PMCC
This collection of images and questions covers topics related to regression analysis, correlation, and the Product Moment Correlation Coefficient (PMCC). Explore concepts such as plotting data to form straight lines, rearranging equations for linear relationships, interpreting correlation coefficien
0 views • 15 slides
Linear Regression Analysis and Correlation Techniques
Learn about correlation and regression analysis in statistics for business, where you explore the relationship between variables through scatter plots, examine patterns, identify outliers, and calculate correlation coefficients to measure the strength of associations. Understand the properties of co
3 views • 56 slides
Correlation in Statistics
Learn about correlation in statistics, from its definition to interpretation. Discover how correlation measures the strength of linear relationships between variables, the difference between positive and negative correlation, and why a correlation of 0 doesn't imply independence. Get insights into h
2 views • 20 slides
Correlation Analysis: Measuring Relationship Strength
Explore the significance of correlation coefficients in statistical inference, particularly the Pearson product-moment correlation coefficient. Learn how to interpret correlation values, determine the strength of relationships, and understand the rule of thumb for correlation levels. Gain insights i
2 views • 47 slides
Correlation and Causation in Data Analysis
Learn about the distinction between correlation and causation in statistics through real-world examples such as the relationship between eating breakfast and student performance, and the correlation between watching soap operas and eating disorders. Discover how correlated occurrences may stem from
1 views • 9 slides
Understand Canonical Correlation Analysis
Canonical Correlation Analysis is a statistical method used to measure the association between two sets of variables by constructing linear combinations and assessing their correlation. This analysis involves creating canonical variables and examining correlations among pairs of linear combinations.
5 views • 15 slides
Scatter Diagram Method for Determining Correlation
Explore the Scatter Diagram Method as the simplest technique for studying correlation between variables. Learn about perfect positive and negative correlation, high degree of positive and negative correlation, and more through visual representations on a graph.
4 views • 11 slides
Spearman's Rank Correlation Coefficient in Data Analysis
Learn about Spearman's rank correlation coefficient, its application, and how it differs from Pearson's correlation coefficient. Explore how to interpret rank correlation coefficients for non-linear data trends.
2 views • 14 slides
Understanding Correlation and Regression in Data Analysis
Learn about correlation and regression in data analysis, including continuous data, scatter plots, Pearson correlation coefficient, and quantifying relationships between variables. Explore the concept of linear relationships and how to interpret correlation coefficients.
3 views • 32 slides
Understanding Correlation Analysis in Biostatistics
Learn about correlation analysis in biostatistics, which explores the relationship between different variables in a sample. Discover the types of correlation, such as positive, negative, and zero correlations, and the importance of correlation coefficients in quantifying these relationships.
4 views • 12 slides
Understanding Correlation and Regression in Statistics
Explore the concepts of correlation and regression in statistics with examples and visuals. Learn about correlation coefficients, scatterplots, direction of relationships, strength of relationships, and Pearson's correlation coefficient. Understand how variables are associated and the degrees to whi
2 views • 42 slides
Understanding Types and Methods of Correlation Analysis
Learn the definition of correlation, types of correlation including positive/negative, simple/partial/multiple, linear/non-linear, and methods of studying correlation like scatter diagram and Pearson's coefficient. Enhance your knowledge in statistical analysis and relationships between variables.
1 views • 12 slides
Understanding Correlation in Statistics: Methods and Interpretation
Explore the concept of correlation in statistics through various examples and visualizations. Learn about different types of correlations, parametric vs non-parametric measures, Pearson's correlation coefficient, and the distinction between regression and correlation. Enhance your understanding of r
3 views • 43 slides
Understanding Correlation and Regression Analysis
Explore the concepts of correlation and regression analysis in data science, including types of correlation, methods of studying correlation, and the difference between positive and negative correlations. Learn how to determine the relationship between variables and understand the limitations of cor
1 views • 41 slides
Understanding Karl Pearson's Coefficient of Correlation
Karl Pearson's Coefficient of Correlation is a widely-used mathematical method to measure the degree and direction of the relationship between linearly related variables. It is denoted by 'r' and indicates the strength and type of correlation between variables. The coefficient ranges from +1 for per
0 views • 5 slides
Understanding Correlation Coefficients in Data Analysis
Learn about the linear correlation coefficient and correlation coefficient, how to compute correlation coefficients, possible values, examples, and a practical example in R coding. Understand how to interpret correlation values and their significance in statistical analysis.
1 views • 12 slides

