Best service for Emergency Tyres in Wood Green
Rickys Tyres Ltd 24HR Mobile Tyre Fitting provides the Best service for Emergency Tyres in Wood Green. Their mission is simple: to deliver professional and efficient tyre solutions, right to your doorstep. They feel pride in being the foremost mobile tyre fitting company in London, dedicated to prov
0 views • 6 slides
Understanding Shifts in Demand Curve
This lesson explores factors that can cause a demand curve to shift, defining terms like Ceteris Paribus and identifying factors influencing demand. Shifts in the demand curve and examples of price influences are discussed, emphasizing the impact of factors beyond price on consumer behavior.
0 views • 16 slides
Understanding Strength-Duration (SD) Curve: A Neuromuscular Diagnostic Test
Strength-Duration (SD) curve is a diagnostic test assessing neuromuscular integrity by measuring the relationship between stimulus strength and duration. It helps in electro-diagnosis of peripheral nervous system disorders and evaluates nerve degeneration and regeneration. The curve is obtained by p
2 views • 17 slides
Understanding the Power of Nonlinear Models in Machine Learning
Delve into the limitations of linear models for handling nonlinear patterns in machine learning. Explore how nonlinear problems can be effectively addressed by mapping inputs to higher-dimensional spaces, enabling linear models to make accurate predictions. Discover the significance of feature mappi
0 views • 15 slides
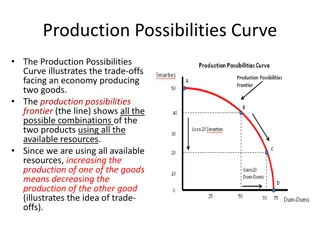
Understanding Production Possibilities Curve and Economic Growth
The Production Possibilities Curve illustrates trade-offs in an economy producing two goods, showing possible combinations using available resources. Efficiency on the curve means no way to make some better off without others worse off. Opportunity cost is the given-up production when increasing one
0 views • 5 slides
Item Characteristic Curve Presentation by Chong Ho Alex Yu
Presentation slides showcasing the item characteristic curve by Chong Ho and Alex Yu. The slides contain detailed information and visuals related to the curve, providing a comprehensive overview of its characteristics and analysis. Each slide presents key insights and data points in a visually engag
0 views • 37 slides
Understanding Curve Fitting Techniques
Curve fitting involves approximating function values using regression and interpolation. Regression aims to find a curve that closely matches target function values, while interpolation approximates points on a function using nearby data. This chapter covers least squares regression for fitting a st
0 views • 48 slides
Understanding Monetary Policy Effectiveness in the IS-LM Framework
The relative effectiveness of monetary policy in influencing investment, employment, output, and income depends on the shape of the LM curve and the IS curve. A steeper LM curve signifies higher effectiveness as it indicates less interest elastic demand for money, resulting in significant changes in
0 views • 24 slides
Understanding the Normal Probability Curve
The Normal Probability Curve, also known as the normal distribution, is a fundamental concept in statistics. It is symmetric around the mean, with key characteristics such as equal numbers of cases above and below the mean, and the mean, median, and mode coinciding. The curve's height decreases grad
0 views • 10 slides
Understanding Strength-Duration Curve in Neuromuscular Stimulation
The strength-duration curve depicts the relationship between electrical stimulus intensity and time required for minimal muscle contraction. It helps assess nerve damage in lower motor neuron lesions. Various types of curves exist based on innervation status, such as normal innervation, complete den
0 views • 15 slides
Best Gas Fitting Services in Lawnton
If you want the Best Gas Fitting Services in Lawnton, visit DJF Plumbing & Gasfitting. They specialize in tap repairs, gas fitting, and servicing, blocked drains, and hot water systems. Their work is guaranteed to be professional and affordable, usin
1 views • 6 slides
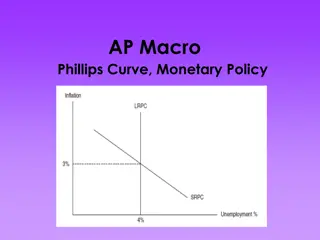
Understanding the Phillips Curve and Its Implications
The Phillips Curve, introduced by economist A.W. Phillips in 1958, initially showed an inverse relationship between unemployment rate (u%) and inflation rate (tt%). This led policymakers to consider a trade-off between reducing unemployment and increasing inflation. However, the concept faced challe
0 views • 22 slides
Understanding Nonlinear Models in Statistics
Nonlinear models in statistics focus on exploring nonlinear relationships between quantitative variables. This involves defining exponential growth and decay, analyzing population data trends like the dramatic turnaround of bald eagles after the ban on DDT, and determining when linear models may not
0 views • 21 slides
Exploring Curve Fitting and Regression Techniques in Neural Data Analysis
Delve into the world of curve fitting and regression analyses applied to neural data, including topics such as simple linear regression, polynomial regression, spline methods, and strategies for balancing fit and smoothness. Learn about variations in fitting models and the challenges of underfitting
0 views • 33 slides
Understanding Global Wind Patterns and the Coriolis Effect
Air pressure differences cause winds, with the Coriolis Effect causing wind paths to curve as air moves from high to low pressure areas. In the Northern Hemisphere, winds curve to the right, and in the Southern Hemisphere, they curve to the left. Planetary and local winds are influenced by temperatu
0 views • 14 slides
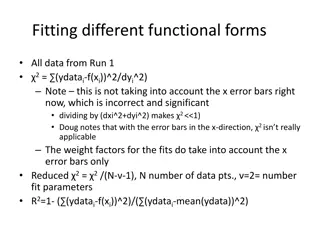
Understanding Functional Form Fitting in Data Analysis
Explore the intricacies of fitting different functional forms to data sets, considering error bars and weight factors. The analysis covers fitting to various models such as A=a+bT, A=a/(1+bT), 1/A=a+bT, 1/A=a+BT, fitting ln(A)=1+bT, and flipping axes to handle thickness errors more effectively. Key
0 views • 14 slides
Analysis of Resolution Study and Charge Scans on 17th Feb 2017
Detailed analysis conducted on 17th Feb 2017 includes resolution calculations, charge scans, attenuation comparisons, and improvements in data fitting. The study compares measured resolutions with predicted scaling, examines the impact of additional information on fitting, and explores peak shifts i
0 views • 30 slides
Unified Pan-Spectrum Fitting Formula for Suprathermal Particles
Unifying spectrum formulas for suprathermal particles, the proposed pan-spectrum formula provides a versatile fitting method encompassing classic double-power-law, band function, and kappa distribution. Motivated by the need for more accurate spectrum information, the formula introduces five paramet
0 views • 14 slides
Statistical Data Analysis: The Method of Least Squares
This module on Statistical Data Analysis covers curve fitting using the method of least squares and an introduction to Machine Learning. Students will learn how to find fitted parameters, statistical errors, and conduct error propagation. The goal is to accurately fit a curve to measured data points
0 views • 36 slides
Bathymetry Trackline Fitting Techniques at ACM SIGSPATIAL GIS 2009
Tsz-Yam Lau, You Li, Zhongyi Xie, and W. Randolph Franklin presented various ship trackline fitting techniques at the ACM SIGSPATIAL GIS 2009 conference in Seattle. The study explored methods such as Inverse Distance Weighting, Kriging, Voronoi, Linear Spline, Quadratic Spline, and more for bathymet
0 views • 12 slides
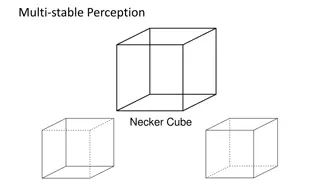
Understanding Multi-Stable Perception and Fitting in Computer Vision
Explore the intriguing concepts of multi-stable perception through visual illusions like the Necker Cube and the Spinning Dancer. Delve into the essentials of feature matching, robust fitting, and alignment in computer vision, including methods for refinement and design challenges. Learn about globa
0 views • 43 slides
QENS Fitting Workshop: Advancing Tools and Strategies
Explore the current limits of QENS fitting tools in Mantid, discuss strategies to surpass these limits, and consider creating an independent library of models. Agenda includes sessions on defining QENS fitting goals, desired functionalities, and experiences as a QENS user or developer. Engage in ses
0 views • 6 slides
Understanding Statistical Modeling and Analysis
Exploring statistical concepts such as mean, variance, skewness, kurtosis, Gaussian distribution, least squares fitting, chi-square fitting, and goodness-of-fit in data analysis. Learn about fitting parameters, probability computation, and interpretation of model goodness.
0 views • 24 slides
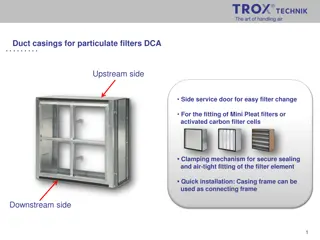
Duct Casings for Particulate Filters DCA: Installation and Filter Element Fitting
Explore the features and installation process of Duct Casings for Particulate Filters DCA, with a focus on easy filter changes, Mini Pleat filter fitting, clamping mechanisms for secure sealing, and support brackets for filter elements. Ensure proper airflow, sealing, and airtight fitting for optima
0 views • 4 slides
Sampling and Parameter Fitting with Hawkes Processes
Learn about sampling and parameter fitting with Hawkes processes in the context of human-centered machine learning. Understand the importance of fitting parameters and sampling raw data event times. Explore the characteristics and fitting methods of Hawkes processes, along with coding assignments an
0 views • 20 slides
Understanding Quantum Algorithms in Data Fitting by Brian Lorn
Data fitting involves establishing relationships between data points, commonly through interpolation, extrapolation, and smoothing methods. Various types and methods of data fitting, such as linear models and statistical tests, contribute to accurate estimations and predictions in different discipli
0 views • 14 slides
Nonlinear Curve Fitting Techniques in Engineering
Utilizing nonlinear curve fitting techniques is crucial in engineering to analyze data relationships that are not linear. This involves transforming nonlinear equations into linear form for regression analysis, as demonstrated in examples and methods such as polynomial interpolation and exponential
0 views • 18 slides
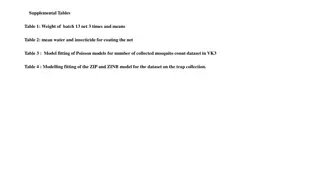
Analysis of Mosquito Collection Data: Net Weight, Water Coating, and Model Fitting
This analysis includes tables detailing the weight of batch 13 nets, mean water and insecticide for coating the net, model fitting of Poisson models for mosquito count dataset, and modeling fitting of ZIP and ZINB models for trap collection data. The tables provide valuable insights into net propert
0 views • 5 slides
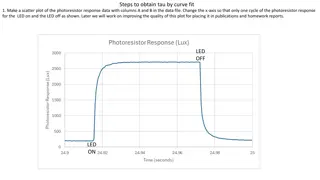
Steps to Obtain Tau by Curve Fit
Learn how to analyze photoresistor response data and obtain the time constant (tau) by curve fitting. Follow steps to create scatter plots, calculate Lux values, model equations, errors, and more to improve the quality of your data analysis. Enhance your data visualization skills and optimize data f
0 views • 24 slides
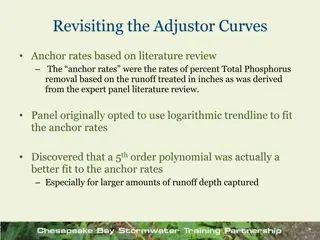
Revisiting Adjustor Curves for Total Phosphorus Removal Rates
Based on a literature review, it was found that a 5th-order polynomial curve is a better fit than the originally used logarithmic trendline for anchor rates of percent Total Phosphorus removal related to runoff depth. The expert panel report reflects the old curves while trendline equations in FAQ d
0 views • 7 slides
Practical Guide to Drawing Long-Term Yield Curve at Krugersdrift Dam
Learn how to draw a long-term yield curve at Krugersdrift Dam step-by-step, including setting up the study, browsing for data, importing hydrology files, manipulating the curve for accuracy, and achieving the final result.
0 views • 7 slides
Understanding Elasticity in Economics
Elasticity in economics refers to the responsiveness of demand to price changes. A more elastic curve results in larger quantity changes for small price changes, while a less elastic curve requires larger price changes to affect quantity consumed. The elasticity of demand can be measured by calculat
1 views • 13 slides
Advanced Emission Line Pipeline for Stellar Kinematics Analysis
This comprehensive pipeline includes processes for stellar kinematics, continuum fitting, Gaussian line fitting, and analysis of SAMI-like cubes. It also covers Gaussian fitting techniques, parameter mapping, and potential issues. The pipeline features detailed steps and strategies for accurate anal
0 views • 10 slides
Visual Analysis: Decisions, Batman's Graphs, COVID Tests, and Flattening the Curve
Explore a collection of images featuring Mythbusters, Batman's original and corrected graphs, alternative Batman heights and weights, COVID tests graph, and a depiction of flattening the curve. Each image provides insight into decision-making, data representation, and visual storytelling. Learn how
0 views • 7 slides
Interpolants in Nonlinear Theories: A Study in Real Numbers
Explore the application of interpolants in nonlinear theories over the real numbers, delving into topics such as reasoning about continuous formulae, Craig interpolation, and branch-and-prune strategies. Discover how nonlinear theories can be both undecidable and decidable with perturbations, captur
0 views • 20 slides
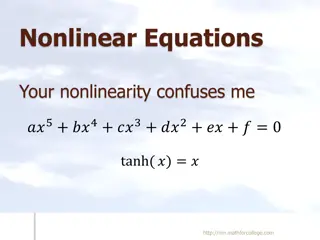
Solving Nonlinear Equations in Engineering Problems
Explore practical applications of solving nonlinear equations in engineering scenarios, including finding submersion depth of floating balls, determining fluid temperatures, and calculating mast height for structural stability. Engage with examples and visuals to enhance your understanding of nonlin
0 views • 38 slides
Understanding Nonlinear Optical Processes in Semiconductors
Exploring the complexities of nonlinear optics in the perturbative and non-perturbative regimes, this research delves into the generation of harmonics, optical Kerr effects, and extreme nonlinear optical phenomena utilizing phase-controlled electromagnetic pulses. The work also investigates the inte
0 views • 15 slides
If you are searching for Gas fitting in North Harbour
If you are searching for Gas fitting in North Harbour, Prentice Solutions Limited is an Auckland-based company that specialises in plumbing, gas fitting, drainage, and roofing. If you are need a plumber or gasfitter who can listen, see your vision, a
0 views • 6 slides
Understanding Linear and Nonlinear Functions in Mathematics
Explore the concepts of linear and nonlinear functions in mathematics through identifying linear and nonlinear functions from graphs, understanding the characteristics of linear functions, and identifying linear functions from tables. Learn about the constant rate of change, slope, and how to determ
0 views • 49 slides
Understanding Production Possibilities Curve and Economic Growth
Explore the concept of the production possibilities curve, including its assumptions, implications of being under or beyond the curve, types of opportunity costs, shifts in the curve, and the impact of economic growth on a nation's productivity and output capacity.
0 views • 18 slides

