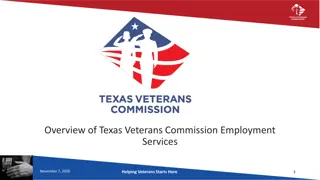
Insights on 2019 Gender and Veteran Demographics


2019 Gender and Veteran
Demographics
Findings from 2019 Annual Averages, Current Population Survey
Dr. Nancy A. Glowacki –glowacki.nancy.a@dol.gov


Veterans are 7.5% of the overall
population

1 in 13 adults is a veteran
U.S. Department of Labor, Bureau of Labor Statistics, 2019 Current Population Survey, Annual Averages, Unpublished Tables
(Calculations done within VETS)
There are nearly 2 million
women veterans (1,884,000)
U.S. Department of Labor, Bureau of Labor Statistics, 2019 Current Population Survey, Annual Averages, Unpublished Tables
(Calculations done within VETS)
Women veterans are 10% of the
overall veteran population
1 in 10 veterans is a woman
U.S. Department of Labor, Bureau of Labor Statistics, 2019 Current Population Survey, Annual Averages, Unpublished Tables
(Calculations done within VETS)
Women are 52% of the general
population
1 in 2 adults is a woman
U.S. Department of Labor, Bureau of Labor Statistics, 2019 Current Population Survey, Annual Averages, Unpublished Tables
(Calculations done within VETS)
Male veterans are 14% of the
overall male population
1 in 7 men is a veteran
U.S. Department of Labor, Bureau of Labor Statistics, 2019 Current Population Survey, Annual Averages, Unpublished Tables
(Calculations done within VETS)
Women veterans are 1.5% of the
overall women population
U.S. Department of Labor, Bureau of Labor Statistics, 2019 Current Population Survey, Annual Averages, Unpublished Tables
(Calculations done within VETS)
1 in 69 women is a veteran
, continued
U.S. Department of Labor, Bureau of Labor Statistics, 2019 Current Population Survey, Annual Averages, Unpublished Tables
(Calculations done within VETS)
Individual women veterans are
still being forgotten
U.S. Department of Labor, Bureau of Labor Statistics, 2019 Current Population Survey, Annual Averages, Unpublished Tables
(Calculations done within VETS)
“Have you ever served in the
military?”
Ask each and every person!
U.S. Department of Labor, Bureau of Labor Statistics, 2019 Current Population Survey, Annual Averages, Unpublished Tables
(Calculations done within VETS)
What if we combine men and women
and veterans and nonveterans?
U.S. Department of Labor, Bureau of Labor Statistics, 2019 Current Population Survey, Annual Averages, Unpublished Tables
(Calculations done within VETS)
Of 100 adults in the overall
population:
7 are male veterans
41 are male nonveterans
1 is a woman veteran
51 are women nonveterans
U.S. Department of Labor, Bureau of Labor Statistics, 2019 Current Population Survey, Annual Averages, Unpublished Tables
(Calculations done within VETS)
Under 35 Years Old…
U.S. Department of Labor, Bureau of Labor Statistics, 2019 Current Population Survey, Annual Averages, Unpublished Tables
(Calculations done within VETS)
Veterans are 2.5% of the overall
under 35 population
1 in 40 adults under 35 is a veteran
U.S. Department of Labor, Bureau of Labor Statistics, 2019 Current Population Survey, Annual Averages, Unpublished Tables
(Calculations done within VETS)
Women are 20% of the overall
under 35 veteran population
1 in 5 veterans under 35 is a woman
U.S. Department of Labor, Bureau of Labor Statistics, 2019 Current Population Survey, Annual Averages, Unpublished Tables
(Calculations done within VETS)
Women are 50% of the general
under 35 population
1 in 2 adults is a woman
U.S. Department of Labor, Bureau of Labor Statistics, 2019 Current Population Survey, Annual Averages, Unpublished Tables
(Calculations done within VETS)
Male veterans are 4% of the
under 35 male population
1 in 25 men under 35 is a veteran
U.S. Department of Labor, Bureau of Labor Statistics, 2019 Current Population Survey, Annual Averages, Unpublished Tables
(Calculations done within VETS)
Veterans are 1% of the under 35
women population
1 in 102 women under 35 is a veteran
U.S. Department of Labor, Bureau of Labor Statistics, 2019 Current Population Survey, Annual Averages, Unpublished Tables
(Calculations done within VETS)
Of 200 adults under 35 in the
overall population:
4 are male veterans
96 are male nonveterans
1 is a woman veteran
99 are women nonveterans
U.S. Department of Labor, Bureau of Labor Statistics, 2019 Current Population Survey, Annual Averages, Unpublished Tables
(Calculations done within VETS)
Era of Service,
Race and Ethnicity,
and Age
U.S. Department of Labor, Bureau of Labor Statistics, 2019 Current Population Survey, Annual Averages, Unpublished Tables
(Calculations done within VETS)
Women veterans are:
twice as likely as male veterans to have served in Gulf War II only,
U.S. Department of Labor, Bureau of Labor Statistics, 2019 Current Population Survey, Annual Averages, Unpublished Tables
(Calculations done within VETS)
Women veterans are:
twice as likely as male veterans to have served in Gulf War II only,
more likely than male veterans to have served in Gulf War I only,
and are more likely to have served in both Gulf War Eras
U.S. Department of Labor, Bureau of Labor Statistics, 2019 Current Population Survey, Annual Averages, Unpublished Tables
(Calculations done within VETS)
Women veterans are:
twice as likely as male veterans to have served in Gulf War II only,
more likely than male veterans to have served in Gulf War I only,
and are almost twice as likely to have served in both Gulf War Eras
Male veterans are three times as likely as women veterans
to have served in WW II, Korean War, Vietnam Eras
U.S. Department of Labor, Bureau of Labor Statistics, 2019 Current Population Survey, Annual Averages, Unpublished Tables
(Calculations done within VETS)
The majority of veterans are white; however
women veterans are less likely than male veterans to be white
U.S. Department of Labor, Bureau of Labor Statistics, 2019 Current Population Survey, Annual Averages, Unpublished Tables
(Calculations done within VETS)
The majority of veterans are white; however
women veterans are less likely than male veterans to be white
Women veterans are more likely than male veterans or
nonveterans of either gender to be Black or African American
U.S. Department of Labor, Bureau of Labor Statistics, 2019 Current Population Survey, Annual Averages, Unpublished Tables
(Calculations done within VETS)
The majority of veterans are white; however
women veterans are less likely than male veterans to be white
Women veterans are almost twice as likely as male veterans or
nonveterans of either gender to be Black or African American
Veterans are less likely than nonveterans to be Asian or
Hispanic/Latino
U.S. Department of Labor, Bureau of Labor Statistics, 2019 Current Population Survey, Annual Averages, Unpublished Tables
(Calculations done within VETS)
The median age of women veterans is 14 years younger
than the median age of male veterans.
Median age
Male veterans:
65 years old
Male nonveterans:
44 years old
Women veterans:
51 years old
Women nonveterans:
48 years old
U.S. Department of Labor, Bureau of Labor Statistics, 2019 Current Population Survey, Annual Averages, Unpublished Tables
(Calculations done within VETS)
Women veterans are more likely to be
of working age than male veterans
Half of all male veterans are 65 years old and over,
compared to 18% of all women veterans
U.S. Department of Labor, Bureau of Labor Statistics, 2019 Current Population Survey, Annual Averages, Unpublished Tables
(Calculations done within VETS)
Women veterans in the work force are
more likely to be of working age
19% of male veterans in the workforce are 65 years
old and over, compared to 5.7% of women veterans
U.S. Department of Labor, Bureau of Labor Statistics, 2019 Current Population Survey, Annual Averages, Unpublished Tables
(Calculations done within VETS)
The civilian labor force includes both people who
are employed and people who are not currently
working, but who are available for work and actively
seeking work (unemployed)
U.S. Department of Labor, Bureau of Labor Statistics, 2019 Current Population Survey, Annual Averages, Unpublished Tables
(Calculations done within VETS)
Women veterans are more likely than male veterans
to be in the labor force
U.S. Department of Labor, Bureau of Labor Statistics, 2019 Current Population Survey, Annual Averages, Unpublished Tables
(Calculations done within VETS)
Civilian Labor Force
U.S. Department of Labor, Bureau of Labor Statistics, 2019 Current Population Survey, Annual Averages, Unpublished Tables
(Calculations done within VETS)
Within the civilian labor force, the median age of women
veterans is 6 years younger than the median age of male
veterans
Median age
Male veterans:
52 years old
Male nonveterans:
41 years old
Women veterans:
46 years old
Women nonveterans:
42 years old
U.S. Department of Labor, Bureau of Labor Statistics, 2019 Current Population Survey, Annual Averages, Unpublished Tables
(Calculations done within VETS)
Veterans are 5.7%
of the civilian labor force
1 in 17 adults in the civilian labor force is
a veteran
U.S. Department of Labor, Bureau of Labor Statistics, 2019 Current Population Survey, Annual Averages, Unpublished Tables
(Calculations done within VETS)
Women are 47% of the labor force
1 in 2 adults in the labor force is a woman
U.S. Department of Labor, Bureau of Labor Statistics, 2019 Current Population Survey, Annual Averages, Unpublished Tables
(Calculations done within VETS)
Women veterans are 12% of
veterans within the civilian labor
force
1 in 8 veterans in the civilian labor force
is a woman
U.S. Department of Labor, Bureau of Labor Statistics, 2019 Current Population Survey, Annual Averages, Unpublished Tables
(Calculations done within VETS)
Women veterans are
1.5% of women in the civilian labor force
1 in 69 women in the civilian labor force is a
veteran
U.S. Department of Labor, Bureau of Labor Statistics, 2019 Current Population Survey, Annual Averages, Unpublished Tables
(Calculations done within VETS)
Male veterans are
9.5% of males in the civilian
labor force
1 in 10 men in the civilian labor force is a
veteran
U.S. Department of Labor, Bureau of Labor Statistics, 2019 Current Population Survey, Annual Averages, Unpublished Tables
(Calculations done within VETS)
Of 100 adults in the civilian labor
force:
5 are male veterans
48 are male nonveterans
1 is a woman veteran
46 are women nonveterans
U.S. Department of Labor, Bureau of Labor Statistics, 2019 Current Population Survey, Annual Averages, Unpublished Tables
(Calculations done within VETS)
Veterans are 2.7% of the under
35 civilian labor force
1 in 38 adults under 35 in the civilian
labor force is a veteran
U.S. Department of Labor, Bureau of Labor Statistics, 2019 Current Population Survey, Annual Averages, Unpublished Tables
(Calculations done within VETS)
Women veterans are 16% of the
veterans under 35 within the
civilian labor force
1 in 6 veterans under 35 in the civilian
labor force is a woman
U.S. Department of Labor, Bureau of Labor Statistics, 2019 Current Population Survey, Annual Averages, Unpublished Tables
(Calculations done within VETS)
Women veterans are .9% of women under 35 in
the civilian labor force
1 in 112 women under 35 in the labor force is a
veteran
U.S. Department of Labor, Bureau of Labor Statistics, 2019 Current Population Survey, Annual Averages, Unpublished Tables
(Calculations done within VETS)
Male veterans are 4.2% of males
under 35 in the civilian labor force
1 in 24 men under 35 in the labor force
is a veteran
U.S. Department of Labor, Bureau of Labor Statistics, 2019 Current Population Survey, Annual Averages, Unpublished Tables
(Calculations done within VETS)
Of 200 adults under 35 in the
civilian labor force:
4 are male veterans
101 are male nonveterans
1 is a woman veteran
94 are women nonveterans
U.S. Department of Labor, Bureau of Labor Statistics, 2019 Current Population Survey, Annual Averages, Unpublished Tables
(Calculations done within VETS)
“Have you ever served in the
military?”
must be asked every time!
U.S. Department of Labor, Bureau of Labor Statistics, 2019 Current Population Survey, Annual Averages, Unpublished Tables
(Calculations done within VETS)
“We are Veterans!!!”
U.S. Department of Labor, Bureau of Labor Statistics, 2019 Current Population Survey, Annual Averages, Unpublished Tables
(Calculations done within VETS)
Closing slide
Dr. Nancy A. Glowacki –
glowacki.nancy.a@dol.gov
Analysis from the 2019 Annual Averages of the Current Population Survey reveals significant statistics regarding gender and veteran populations in the United States. Data indicates that veterans comprise 7.5% of the overall population, with women veterans totaling almost 2 million. Women veterans make up 10% of the total veteran population, while male veterans account for 14% of the male population. Further, women constitute 52% of the general population, with 1 in 2 adults being female. Notably, 1 in 69 women is identified as a veteran.

Download Presentation

Please find below an Image/Link to download the presentation.
The content on the website is provided AS IS for your information and personal use only. It may not be sold, licensed, or shared on other websites without obtaining consent from the author.If you encounter any issues during the download, it is possible that the publisher has removed the file from their server.
You are allowed to download the files provided on this website for personal or commercial use, subject to the condition that they are used lawfully. All files are the property of their respective owners.
The content on the website is provided AS IS for your information and personal use only. It may not be sold, licensed, or shared on other websites without obtaining consent from the author.
E N D
Presentation Transcript
2019 Gender and Veteran Demographics Findings from 2019 Annual Averages, Current Population Survey Findings from 2019 Annual Averages, Current Population Survey Dr. Nancy A. Glowacki glowacki.nancy.a@dol.gov
Veterans are 7.5% of the overall population 1 in 13 adults is a veteran U.S. Department of Labor, Bureau of Labor Statistics, 2019 Current Population Survey, Annual Averages, Unpublished Tables (Calculations done within VETS)
There are nearly 2 million women veterans (1,884,000) U.S. Department of Labor, Bureau of Labor Statistics, 2019 Current Population Survey, Annual Averages, Unpublished Tables (Calculations done within VETS)
Women veterans are 10% of the overall veteran population 1 in 10 veterans is a woman U.S. Department of Labor, Bureau of Labor Statistics, 2019 Current Population Survey, Annual Averages, Unpublished Tables (Calculations done within VETS)
Women are 52% of the general population 1 in 2 adults is a woman U.S. Department of Labor, Bureau of Labor Statistics, 2019 Current Population Survey, Annual Averages, Unpublished Tables (Calculations done within VETS)
Male veterans are 14% of the overall male population 1 in 7 men is a veteran U.S. Department of Labor, Bureau of Labor Statistics, 2019 Current Population Survey, Annual Averages, Unpublished Tables (Calculations done within VETS)
Women veterans are 1.5% of the overall women population U.S. Department of Labor, Bureau of Labor Statistics, 2019 Current Population Survey, Annual Averages, Unpublished Tables (Calculations done within VETS)
1 in 69 women is a veteran , continued U.S. Department of Labor, Bureau of Labor Statistics, 2019 Current Population Survey, Annual Averages, Unpublished Tables (Calculations done within VETS)
Individual women veterans are still being forgotten U.S. Department of Labor, Bureau of Labor Statistics, 2019 Current Population Survey, Annual Averages, Unpublished Tables (Calculations done within VETS)
Have you ever served in the military? Ask each and every person! U.S. Department of Labor, Bureau of Labor Statistics, 2019 Current Population Survey, Annual Averages, Unpublished Tables (Calculations done within VETS)
What if we combine men and women and veterans and nonveterans? U.S. Department of Labor, Bureau of Labor Statistics, 2019 Current Population Survey, Annual Averages, Unpublished Tables (Calculations done within VETS)
Of 100 adults in the overall population: 7 are male veterans 41 are male nonveterans 1 is a woman veteran 51 are women nonveterans U.S. Department of Labor, Bureau of Labor Statistics, 2019 Current Population Survey, Annual Averages, Unpublished Tables (Calculations done within VETS)
Under 35 Years Old U.S. Department of Labor, Bureau of Labor Statistics, 2019 Current Population Survey, Annual Averages, Unpublished Tables (Calculations done within VETS)
Veterans are 2.5% of the overall under 35 population 1 in 40 adults under 35 is a veteran U.S. Department of Labor, Bureau of Labor Statistics, 2019 Current Population Survey, Annual Averages, Unpublished Tables (Calculations done within VETS)
Women are 20% of the overall under 35 veteran population 1 in 5 veterans under 35 is a woman U.S. Department of Labor, Bureau of Labor Statistics, 2019 Current Population Survey, Annual Averages, Unpublished Tables (Calculations done within VETS)
Women are 50% of the general under 35 population 1 in 2 adults is a woman U.S. Department of Labor, Bureau of Labor Statistics, 2019 Current Population Survey, Annual Averages, Unpublished Tables (Calculations done within VETS)
Male veterans are 4% of the under 35 male population 1 in 25 men under 35 is a veteran U.S. Department of Labor, Bureau of Labor Statistics, 2019 Current Population Survey, Annual Averages, Unpublished Tables (Calculations done within VETS)
Veterans are 1% of the under 35 women population 1 in 102 women under 35 is a veteran U.S. Department of Labor, Bureau of Labor Statistics, 2019 Current Population Survey, Annual Averages, Unpublished Tables (Calculations done within VETS)
Of 200 adults under 35 in the overall population: 4 are male veterans 96 are male nonveterans 1 is a woman veteran 99 are women nonveterans U.S. Department of Labor, Bureau of Labor Statistics, 2019 Current Population Survey, Annual Averages, Unpublished Tables (Calculations done within VETS)
Era of Service, Race and Ethnicity, and Age U.S. Department of Labor, Bureau of Labor Statistics, 2019 Current Population Survey, Annual Averages, Unpublished Tables (Calculations done within VETS)
Women veterans are: twice as likely as male veterans to have served in Gulf War II only, twice as likely as male veterans to have served in Gulf War II only, U.S. Department of Labor, Bureau of Labor Statistics, 2019 Current Population Survey, Annual Averages, Unpublished Tables (Calculations done within VETS)
Women veterans are: twice as likely as male veterans to have served in Gulf War II only, more likely than male veterans to have served in Gulf War I only, more likely than male veterans to have served in Gulf War I only, U.S. Department of Labor, Bureau of Labor Statistics, 2019 Current Population Survey, Annual Averages, Unpublished Tables (Calculations done within VETS)
Women veterans are: twice as likely as male veterans to have served in Gulf War II only, more likely than male veterans to have served in Gulf War I only, and are more likely to have served in both Gulf War Eras and are more likely to have served in both Gulf War Eras U.S. Department of Labor, Bureau of Labor Statistics, 2019 Current Population Survey, Annual Averages, Unpublished Tables (Calculations done within VETS)
Women veterans are: twice as likely as male veterans to have served in Gulf War II only, more likely than male veterans to have served in Gulf War I only, and are almost twice as likely to have served in both Gulf War Eras Male veterans are three times as likely as women veterans Male veterans are three times as likely as women veterans to have served in WW II, Korean War, Vietnam Eras to have served in WW II, Korean War, Vietnam Eras U.S. Department of Labor, Bureau of Labor Statistics, 2019 Current Population Survey, Annual Averages, Unpublished Tables (Calculations done within VETS)
The majority of veterans are white; however The majority of veterans are white; however women veterans are less likely than male veterans to be white women veterans are less likely than male veterans to be white U.S. Department of Labor, Bureau of Labor Statistics, 2019 Current Population Survey, Annual Averages, Unpublished Tables (Calculations done within VETS)
The majority of veterans are white; however women veterans are less likely than male veterans to be white Women veterans are more likely than male veterans or Women veterans are more likely than male veterans or nonveterans of either gender to be Black or African American nonveterans of either gender to be Black or African American U.S. Department of Labor, Bureau of Labor Statistics, 2019 Current Population Survey, Annual Averages, Unpublished Tables (Calculations done within VETS)
The majority of veterans are white; however women veterans are less likely than male veterans to be white Women veterans are almost twice as likely as male veterans or nonveterans of either gender to be Black or African American Veterans are less likely than nonveterans to be Asian or Veterans are less likely than nonveterans to be Asian or Hispanic/Latino Hispanic/Latino U.S. Department of Labor, Bureau of Labor Statistics, 2019 Current Population Survey, Annual Averages, Unpublished Tables (Calculations done within VETS)
The median age of women veterans is 14 years younger than the median age of male veterans. Median age Male veterans: Male nonveterans: Women veterans: Women nonveterans: 65 years old 44 years old 51 years old 48 years old U.S. Department of Labor, Bureau of Labor Statistics, 2019 Current Population Survey, Annual Averages, Unpublished Tables (Calculations done within VETS)
Women veterans are more likely to be of working age than male veterans Half of all male veterans are 65 years old and over, compared to 18% of all women veterans U.S. Department of Labor, Bureau of Labor Statistics, 2019 Current Population Survey, Annual Averages, Unpublished Tables (Calculations done within VETS)
Women veterans in the work force are more likely to be of working age 19% of male veterans in the workforce are 65 years old and over, compared to 5.7% of women veterans U.S. Department of Labor, Bureau of Labor Statistics, 2019 Current Population Survey, Annual Averages, Unpublished Tables (Calculations done within VETS)
The civilian labor force includes both people who are employed and people who are not currently working, but who are available for work and actively seeking work (unemployed) U.S. Department of Labor, Bureau of Labor Statistics, 2019 Current Population Survey, Annual Averages, Unpublished Tables (Calculations done within VETS)
Women veterans are more likely than male veterans to be in the labor force U.S. Department of Labor, Bureau of Labor Statistics, 2019 Current Population Survey, Annual Averages, Unpublished Tables (Calculations done within VETS)
Civilian Labor Force U.S. Department of Labor, Bureau of Labor Statistics, 2019 Current Population Survey, Annual Averages, Unpublished Tables (Calculations done within VETS)
Within the civilian labor force, the median age of women veterans is 6 years younger than the median age of male veterans Median age Women veterans: 46 years old Male nonveterans: 41 years old Women nonveterans: 42 years old Male veterans: 52 years old U.S. Department of Labor, Bureau of Labor Statistics, 2019 Current Population Survey, Annual Averages, Unpublished Tables (Calculations done within VETS)
Veterans are 5.7% of the civilian labor force 1 in 17 adults in the civilian labor force is a veteran U.S. Department of Labor, Bureau of Labor Statistics, 2019 Current Population Survey, Annual Averages, Unpublished Tables (Calculations done within VETS)
Women are 47% of the labor force 1 in 2 adults in the labor force is a woman U.S. Department of Labor, Bureau of Labor Statistics, 2019 Current Population Survey, Annual Averages, Unpublished Tables (Calculations done within VETS)
Women veterans are 12% of veterans within the civilian labor force 1 in 8 veterans in the civilian labor force is a woman U.S. Department of Labor, Bureau of Labor Statistics, 2019 Current Population Survey, Annual Averages, Unpublished Tables (Calculations done within VETS)
Women veterans are 1.5% of women in the civilian labor force 1 in 69 women in the civilian labor force is a veteran U.S. Department of Labor, Bureau of Labor Statistics, 2019 Current Population Survey, Annual Averages, Unpublished Tables (Calculations done within VETS)
Male veterans are 9.5% of males in the civilian labor force 1 in 10 men in the civilian labor force is a veteran U.S. Department of Labor, Bureau of Labor Statistics, 2019 Current Population Survey, Annual Averages, Unpublished Tables (Calculations done within VETS)
Of 100 adults in the civilian labor force: 5 are male veterans 48 are male nonveterans U.S. Department of Labor, Bureau of Labor Statistics, 2019 Current Population Survey, Annual Averages, Unpublished Tables (Calculations done within VETS) 1 is a woman veteran 46 are women nonveterans
Veterans are 2.7% of the under 35 civilian labor force 1 in 38 adults under 35 in the civilian labor force is a veteran U.S. Department of Labor, Bureau of Labor Statistics, 2019 Current Population Survey, Annual Averages, Unpublished Tables (Calculations done within VETS)
Women veterans are 16% of the veterans under 35 within the civilian labor force 1 in 6 veterans under 35 in the civilian labor force is a woman U.S. Department of Labor, Bureau of Labor Statistics, 2019 Current Population Survey, Annual Averages, Unpublished Tables (Calculations done within VETS)
Women veterans are .9% of women under 35 in the civilian labor force 1 in 112 women under 35 in the labor force is a veteran U.S. Department of Labor, Bureau of Labor Statistics, 2019 Current Population Survey, Annual Averages, Unpublished Tables (Calculations done within VETS)
Male veterans are 4.2% of males under 35 in the civilian labor force 1 in 24 men under 35 in the labor force is a veteran U.S. Department of Labor, Bureau of Labor Statistics, 2019 Current Population Survey, Annual Averages, Unpublished Tables (Calculations done within VETS)
Of 200 adults under 35 in the civilian labor force: 4 are male veterans 101 are male nonveterans U.S. Department of Labor, Bureau of Labor Statistics, 2019 Current Population Survey, Annual Averages, Unpublished Tables (Calculations done within VETS) 1 is a woman veteran 94 are women nonveterans
Have you ever served in the military? must be asked every time! U.S. Department of Labor, Bureau of Labor Statistics, 2019 Current Population Survey, Annual Averages, Unpublished Tables (Calculations done within VETS)
We are Veterans!!! U.S. Department of Labor, Bureau of Labor Statistics, 2019 Current Population Survey, Annual Averages, Unpublished Tables (Calculations done within VETS)
Closing slide Dr. Nancy A. Glowacki glowacki.nancy.a@dol.gov