Maximizing TV Effectiveness Through Creative Advertising Strategies
Discover the power of auditory attention, creative quality, and strategic daypart targeting in TV advertising for optimal brand performance in 2023. Insights on ad profitability, audience engagement, and media planning strategies presented.
Download Presentation
Please find below an Image/Link to download the presentation.
The content on the website is provided AS IS for your information and personal use only. It may not be sold, licensed, or shared on other websites without obtaining consent from the author. Download presentation by click this link. If you encounter any issues during the download, it is possible that the publisher has removed the file from their server.

Presentation Transcript
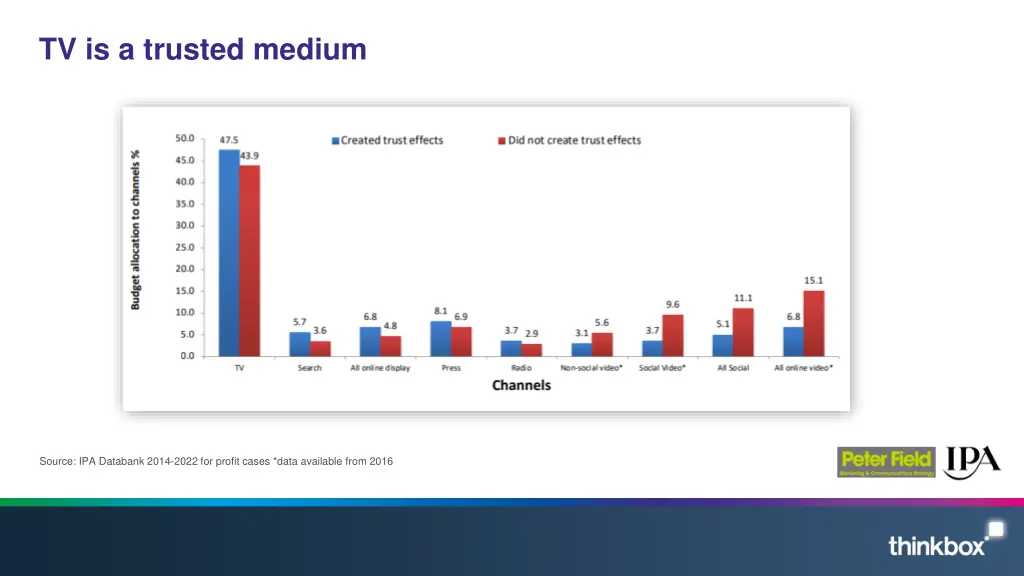
TV is a trusted medium Source: IPA Databank 2014-2022 for profit cases *data available from 2016
Ads that conveyed information in both a visual and auditory way performed better Looked like something I heard / Sounded like something I saw % responses at high attention but low confidence 100% 90% 80% 70% 65% 60% 53% 50% 40% 30% 20% JD Sports, The Bag For Life 10% 0% Visual and Auditory ads Visually dominant ads Source: Competing for Attention, GITR / Thinkbox 2023, n=305. Full attention state only
Auditory attention more resilient to distraction than visual attention Source: Competing for Attention, GITR / Thinkbox, 2023, n=305
Creativity is the biggest advertising profitability multiplier within our control Potential multipliers of advertising profitability - (2023) X 20 X 12 X 5 X 3 X 2.5 X 2.0 X 1.7 X 1.6 X 1.2 X 1.1 Budget setting across variants Budget setting across portfolios Budget setting across geographies Cost / Product seasonality Brand : Performance Multi- media Target audience Laydown / Phasing Brand size Creative quality Source: The Drivers of Profitability, 2023, Paul Dyson - accelero, ROI multiplier = area of the circle
Sustaining ESOV essential for brands in 2023 30% Q1 2023 Avg. 2018 to 2022 (Q1 only) 25% SHARE OF LINEAR TV VOICE (Q1) 20% 15% 10% 5% 0% 0% 5% 10% 15% 20% 25% 30% SHARE OF MARKET (2022) Source: BARB / ESM magazine / company financial reports
30 second ads deliver the greatest impact Source: Creative Drivers of Effectiveness, 2023, Neuro-Insight/Thinkbox
Late evenings and weekends are valuable dayparts when targeting Reach Extenders Reach Extenders index by daypart 6am 7am 8am 9am 10am 11am 12pm 1pm 2pm 3pm 4pm 5pm 6pm 7pm 8pm 9pm 10pm 11pm 12am 1am 2am 3am 4am 5am 58 71 71 63 71 79 77 74 70 68 65 68 81 103 130 165 136 98 69 56 46 40 32 40 Monday 57 72 67 64 60 53 67 68 62 54 59 66 79 112 145 170 135 99 71 61 50 38 27 52 Tuesday 63 77 63 57 59 60 66 70 59 57 58 68 83 111 137 169 136 104 82 65 52 34 23 38 Wednesday 62 73 73 58 57 57 66 71 63 60 64 66 81 115 134 160 139 112 88 78 60 46 34 41 Thursday 57 73 70 67 64 63 70 72 62 60 60 64 80 104 128 155 151 128 101 75 54 40 39 38 Friday 48 72 78 78 78 73 82 88 87 80 77 83 96 108 124 141 133 114 88 68 54 45 43 41 Saturday 53 68 77 78 73 70 74 77 92 97 94 98 101 106 122 140 122 97 71 60 46 29 23 42 Sunday Monday 103 Tuesday 98 Wednesday Thursday 95 Friday 96 Saturday 105 Sunday 110 92 Source: Barb Q3 2022, commercial linear & BVOD, Reach Extender index vs all adults.
Electric/hybrid vehicles are motoring ahead in TV advertising 2022 75% 15% 10% 2021 72% 13% 16% 2020 50% 25% 25% 2019 23% 37% 40% 2018 8% 42% 50% 0% 10% 20% 30% 40% Proportion of linear TV expenditure 50% 60% 70% 80% 90% 100% Hybrid/Electric/Alternative 4x4/SUV/Crossovers Other Source: Nielsen Ad Intel, linear TV expenditure, Advertisers and brands included in this analysis are a Thinkbox created category specifically in relation to cars (and includes brand building), and does not include other vehicles, car dealers or motor accessories etc. Other includes all other categories in product / advertiser mid category
B2B TV advertising spend has doubled since 2018 120 9% + 9m 27% + 21m 108 100 99 5% + 3m 46% 80 + 23m 78 75 m 60 51 40 20 - 2018 2019 2020 2021 2022 Source: Nielsen Ad Intel, 2018-2022, TV Spend, % s show YoY Increase, Thinkbox-created category of B2B businesses
Commercial broadcasters are unrivalled for scale 45,000 All Individuals All devices 40,000 AVERAGE DAILY REACH (000s) 35,000 30,000 Bubble area represents total volume of daily viewing 25,000 20,000 15,000 10,000 5,000 Other AVOD Other SVOD - 12:00:00 AM 12:30:00 AM 1:00:00 AM 1:30:00 AM 2:00:00 AM 2:30:00 AM 3:00:00 AM 3:30:00 AM 4:00:00 AM AVE TIME VIEWED PER VIEWER PER DAY Source: Barb / All devices 2022
Broadcaster TV was two thirds of Barbs identified viewing in Dec 2022 Source: BARB, Individuals 4+, Barb Online Multiple Screens Network, 1st 31stDecember 2022