ACT Public Health Services Quarterly Performance Report
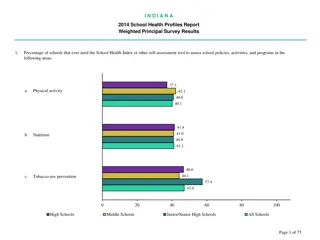
This quarterly report provides detailed performance data on ACT public health services, sourced from various systems including the Australian Bureau of Statistics, ACT Patient Administration System, and more. Performance is compared across different quarters and against recommended standards, with data categorized by priority, acuity, and urgency levels. Measurements are peer-reviewed for quality assurance, and indicators reflect the clinical quality of hospital services. The report includes definitions, terms, and indicators related to Walk-in Centres, COVID-19 Testing Centres, and Emergency Departments. Variance calculations are used to assess changes in performance metrics.

Download Presentation

Please find below an Image/Link to download the presentation.
The content on the website is provided AS IS for your information and personal use only. It may not be sold, licensed, or shared on other websites without obtaining consent from the author. Download presentation by click this link. If you encounter any issues during the download, it is possible that the publisher has removed the file from their server.
E N D
Presentation Transcript
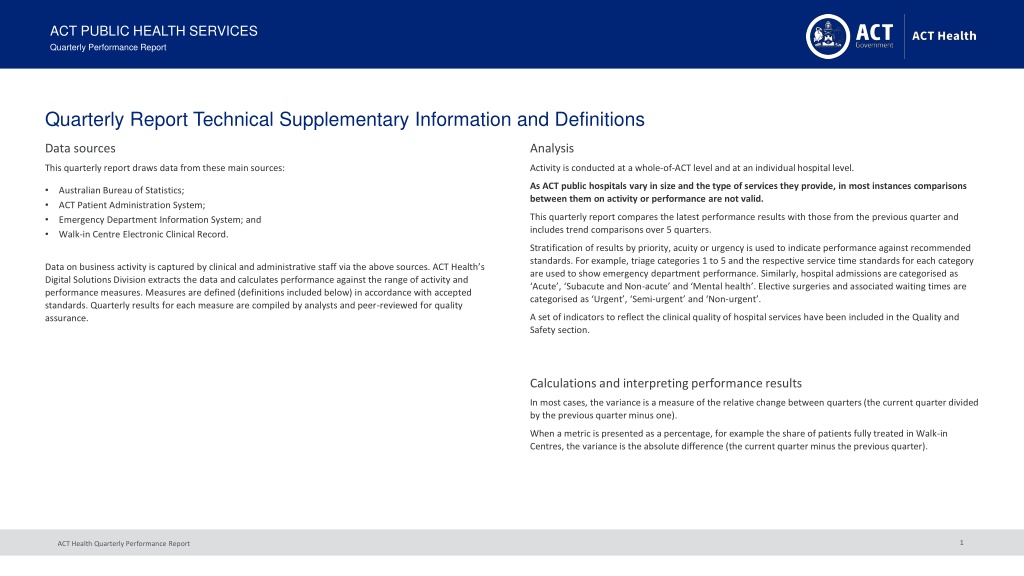
ACT PUBLIC HEALTH SERVICES Quarterly Performance Report Quarterly Report Technical Supplementary Information and Definitions Data sources Analysis This quarterly report draws data from these main sources: Activity is conducted at a whole-of-ACT level and at an individual hospital level. As ACT public hospitals vary in size and the type of services they provide, in most instances comparisons between them on activity or performance are not valid. Australian Bureau of Statistics; ACT Patient Administration System; Emergency Department Information System; and Walk-in Centre Electronic Clinical Record. This quarterly report compares the latest performance results with those from the previous quarter and includes trend comparisons over 5 quarters. Stratification of results by priority, acuity or urgency is used to indicate performance against recommended standards. For example, triage categories 1 to 5 and the respective service time standards for each category are used to show emergency department performance. Similarly, hospital admissions are categorised as Acute , Subacute and Non-acute and Mental health . Elective surgeries and associated waiting times are categorised as Urgent , Semi-urgent and Non-urgent . Data on business activity is captured by clinical and administrative staff via the above sources. ACT Health s Digital Solutions Division extracts the data and calculates performance against the range of activity and performance measures. Measures are defined (definitions included below) in accordance with accepted standards. Quarterly results for each measure are compiled by analysts and peer-reviewed for quality assurance. A set of indicators to reflect the clinical quality of hospital services have been included in the Quality and Safety section. Calculations and interpreting performance results In most cases, the variance is a measure of the relative change between quarters (the current quarter divided by the previous quarter minus one). When a metric is presented as a percentage, for example the share of patients fully treated in Walk-in Centres, the variance is the absolute difference (the current quarter minus the previous quarter). 1 ACT Health Quarterly Performance Report
ACT PUBLIC HEALTH SERVICES Quarterly Performance Report Terms and definitions Walk-in Centres (WiC) WiC presentations Number of attendances at all WiCs during the quarter. Presentations at WiC location Number of attendances at the individual WiC during the quarter. COVID-19 Testing Centres presentations Number of attendances at all COVID-19 testing centres for the quarter. Presentations at COVID-19 testing centre location Number of attendances at individual COVID-19 testing centres for the quarter. Median wait time to treatment Median time that patients waited from arrival to treatment commencing, in minutes, at all WiCs during the quarter. Median wait time at WiC location Median time that patients waited from arrival to treatment commencing, in minutes, at the individual WiCs during the quarter. Treatment provided at the WiC Proportion of all presentations to a WiC where the final disposition is not classified as a redirection or did not wait, during the quarter. Treatment provided at WiC location Proportion of presentations at a WiC location where the final disposition is not classified as a redirection or did not wait, during the quarter. Percentage redirected to ED Percentage of all WiC attendances that were redirected to an emergency department during the quarter. Redirected to ED from location Percentage of WiC attendances that were redirected to an emergency department during the quarter. 2 ACT Health Quarterly Performance Report
ACT PUBLIC HEALTH SERVICES Quarterly Performance Report Terms and definitions continued Emergency departments (EDs) ED Presentations Number of patient attendances at EDs that were completed during the quarter. ED Presentations by triage category Number of patient attendances at EDs within each triage category (1 Resuscitation; 2 Emergency; 3 Urgent; 4 Semi-urgent; 5 Non-urgent). Admission to hospitals from EDs Number of patient attendances at EDs where the outcome was admission to hospital. Patients treated and discharged home Number of patient attendances at EDs where the outcome was treatment and discharge to home. Arrivals at ED by Ambulance Number of attendances at EDs where the patient arrived by ambulance. Patients starting ED treatment on time by triage category Percentage of patients starting treatment within the recommended timeframe for their triage category (Category 1 immediate/within 2 minutes; Category 2 within 10 minutes, Category 3 within 30 minutes; Category 4 within 60 minutes, Category 5 within 120 minutes). Patients starting ED treatment on time for all triage categories combined Percentage of ED patients starting treatment within the recommended timeframe for all triage categories combined. Patients leaving ED within 4 hours Percentage of attendances at EDs where the patient was either discharged (defined as when the patient was ready to depart) from the ED or subsequently admitted as an admitted patient, within 4 hours of arriving. Patients who did not wait to be seen Percentage of attendances at EDs where the patient did not wait to be seen by a health care professional. Admissions from ED Percentage of patient attendance at EDs that resulted in an admission to hospital. Median waiting time to treatment in ED by urgency category Median time between arriving at the ED and commencing treatment, by triage category. Calculated for patients where their treatment was completed. 3 ACT Health Quarterly Performance Report
ACT PUBLIC HEALTH SERVICES Quarterly Performance Report Terms and definitions continued Admitted patients Admitted patient episodes of care Number of hospitalisations that ended during the quarter. Same day episodes of care Number of hospitalisations for patients admitted to and discharged from hospital on the same date. Overnight episodes of care Number of hospitalisations for patients admitted to and discharged from hospital on different dates. Total bed days of care Sum of days stayed by patients discharged from hospital in the quarter (same day episodes are counted as 1 bed day). Total overnight bed days of care Sum of days stayed by patients discharged from hospital in the quarter, where the patient stayed overnight. Acute overnight bed days Sum of overnight bed days where hospitalisations were categorised as acute care. Subacute and Non-acute overnight bed days Sum of overnight bed days where hospitalisations were categorised as subacute or non-acute care. Mental health accrued care days Sum of mental health care days of patients/residents occurring within the quarter. Babies born The number of babies born in hospital during the quarter. Babies born by caesarean section The number of babies born in hospital during the quarter where the birth method was caesarean section. Average Length of Stay (ALOS) for overnight patients ALOS for overnight hospitalisations for patients discharged during the quarter. ALOS for acute patients ALOS for overnight hospitalisations that were categorised as acute care. ALOS for subacute and non-acute patients ALOS for overnight hospitalisations that were categorised as subacute or non-acute care. ALOS for mental health patients ALOS for overnight hospitalisations that were categorised as mental health care. Note: For hospitalisations that involved newborn babies, only the qualified days, an equivalent of acute patient days, were counted towards the patient s hospital stay. 4 ACT Health Quarterly Performance Report
ACT PUBLIC HEALTH SERVICES Quarterly Performance Report Terms and definitions continued Elective surgery Total elective surgery procedures Number of elective surgery procedures performed during the quarter. Category 1 urgent elective surgery procedures performed Number of elective surgery procedures performed during the quarter that were categorised by the patient s surgeon as Urgency Category 1 (required within 30 days). Category 2 semi-urgent elective surgery procedures performed Number of elective surgery procedures performed during the quarter that were categorised by the patient s surgeon as Urgency Category 2 (required within 90 days). Category 3 non-urgent elective surgery procedures performed Number of elective surgery procedures performed during the quarter that were categorised by the patient s surgeon as Urgency Category 3 (required within 365 days). Patients removed from the elective surgery waiting list for reasons other than surgery Number of patients removed from the ACT elective surgery waiting list for reasons other than surgery for the awaited procedure during the quarter. Additions to the ACT elective surgery waiting list Number of patients added to the ACT elective surgery waiting list during the quarter. Patients waiting for elective surgery Number of patients on the ACT elective surgery waiting list at the end of the quarter who are classed as waiting for surgery and who are ready for care. Patients overdue for elective surgery Number of patients on the ACT elective surgery waiting list at the end of the quarter who have waited longer than the recommended timeframes for their respective urgency category. Urgent elective surgeries performed on time Percentage of urgent elective surgeries performed during the quarter where patients waited 30 days or less. Semi-urgent elective surgeries performed on time Percentage of semi-urgent elective surgeries performed during the quarter where patients waited 90 days or less. Non-urgent elective surgeries performed on time Percentage of non-urgent elective surgeries performed during the quarter where patients waited 365 days or less. Median waiting time to surgery Median time spent waiting for surgery for patients who were removed from the elective surgery waiting list during the quarter. This excludes any days the patient was waiting with a less urgent clinical urgency category than their clinical urgency category at removal, and excludes any days where the patient was not ready for surgery. 5 ACT Health Quarterly Performance Report
ACT PUBLIC HEALTH SERVICES Quarterly Performance Report Terms and definitions continued Quality and Safety Number of avoidable readmissions for selected conditions per 10,000 hospital admissions Number of avoidable readmissions for selected conditions per 10,000 hospital admissions (where the re-admission was unforeseen at the time of discharge). Number of surgical complications requiring unplanned return to theatre per 10,000 hospital admissions associated with the primary reason the patient was in hospital. Number of surgical complications requiring unplanned return to theatre per 10,000 hospital admissions Number of patients per 10,000 occupied bed days who acquire a Staphylococcusaureus bacteraemia infection (SAB infection) The number of SAB infection cases per 10,000 occupied bed days. Estimated Hand Hygiene Rate The estimated hand hygiene rate for a hospital is a measure of how often (as a percentage) hand hygiene is correctly performed. 6 ACT Health Quarterly Performance Report