Understanding Signal Detection Theory in Psychophysics

Signal detection theory
Nisheeth
7
th
February 2019

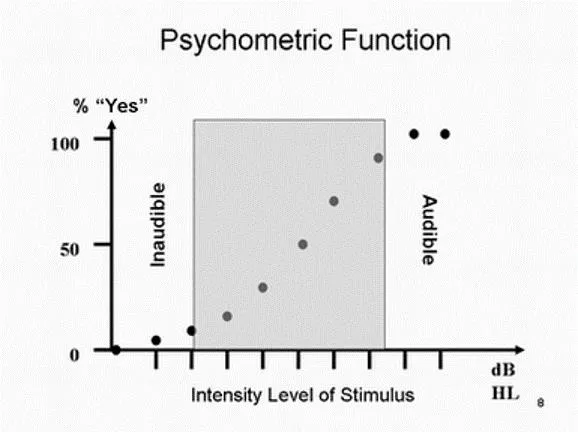
Psychometric function
•
Mathematical device
–
Parametrically model
relationship between
stimuli features and
observer response
•
Yes/no
•
2AFC
•
nAFC
Fitting psychometric functions
•
Typically use a function of
approximately sigmoid form
–
Probit
–
Sigmoid
–
Weibull
•
Modified by a lapse and a
guess parameter
•
Ψ
(x) =
δ
+ (1 –
δ
-
λ
)F(x;
α
,
β
)
–
E.g. F = 1 – exp(-(x/
α
)
β
)
–
Fit using least squares/ML
•
Key psychometric parameters
–
Slope
–
Threshold
–
Guess
–
Lapse
Psychometrics summary
•
Stimuli detection is stochastic
•
Psychophysical calculations allow us to
measure
–
Bias
–
Sensitivity
•
Can also extend this basic principle to non-
perceptual measurements
–
We see how next
•
Signal detection theory: A psychophysical
theory that quantifies the response of an
observer to the presentation of a signal in the
presence of noise.
Signal detection theory
•
Four possible stimulus/response situations in
signal detection theory:
–
Hit: Stimulus is present and observer
responds “Yes.”
–
Miss: Stimulus is present and observer
responds “No.”
–
False alarm: Stimulus is not present and
observer responds “Yes.”
–
Correct rejection: Stimulus is not present
and observer responds “No.”
Signal detection theory
•
Signal detection theory makes a distinction
between an observers’ ability to perceive a
signal and their willingness to report it. These
are two separate concepts:
–
Sensitivity
–
Criterion
Key concepts
–
Sensitivity: A value that defines the ease with
which an observer can tell the difference
between the presence and absence of a
stimulus or the difference between stimulus 1
and stimulus 2.
–
Criterion: An internal threshold that is set by
the observer.
•
If the internal response is above criterion,
the observer gives one response.
•
Below criterion, the observer gives another
response.
Key concepts
What does the variance in response to
stimuli mean?
•
Mixed selectivity of stimulus-neuron mapping
Stimuli
Neuron
Stimuli to neuron mapping is many-to-many, so for any one stimulus,
multiple neurons will respond to varying degrees
http://www.sciencedirect.com/science/article/pii/S0959438816000118?via%3Dihub
(Gold & Ding, 2013)
•
Receiver operating characteristic (ROC): In
studies of signal detection, the graphical plot
of the hit rate as a function of the false alarm
rate.
–
Chance performance will fall along the
diagonal.
–
Good performance (high sensitivity) “bows
out” towards the upper left corner.
ROC
•
Plotting the ROC curve allows one to predict
the proportion of hits for a given proportion
of false alarms, and vice-versa.
–
Changes in criteria move performance
along a curve but do not change the shape
of the curve.
–
Application: we want to figure out how
good radiologists are in looking for tumors
in CT scans
ROC
Tumor perception
Internal responses will have some variability because of mixed
neuronal selectivity
Criterion for deciding if there is a tumor present in a scan will
determine classification performance
Criterion shift affects performance
•
Conservative criterion
low false alarm rate,
low hit rate
•
Aggressive criterion
high hit rate, high false
alarm rate
SDT tries to disambiguate
•
D’ measures sensitivity
•
Estimated as z(HR) –
z(FAR)
•
C measures criterion
•
Calculated as -0.5[z(HR)
+ z(FAR)]
https://www.birmingham.ac.uk/Documents/college-les/psych/vision-
laboratory/sdtintro.pdf
D’ calculation
•
D’ = z(HR) – z(FAR). Assume N(0,1) for
numerical calculation
C calculation
•
C = midpoint between z(HR) and z(FAR)
Example
•
HR = 0.84, FAR = 0.16
•
D’ = z(0.84) – z(0.16) = 1 – (-1) = 2
•
C = 0
•
HR = 0.5, FAR = 0.023
•
D’ = z(0.5) – z(0.023) = 0 – (-2) = 2
•
C = [z(0.5) + z(0.023)]/2 = 1 (bias for saying no)
Same information present for both decision-makers
Criterion shift moves decision-maker along ROC curve
Signal Detection Theory in psychophysics quantifies how observers respond to signals in noise. It involves mathematical models like psychometric functions to measure bias and sensitivity in detecting stimuli. Key concepts include sensitivity and criterion in distinguishing signal perception and reporting willingness.

Download Presentation

Please find below an Image/Link to download the presentation.
The content on the website is provided AS IS for your information and personal use only. It may not be sold, licensed, or shared on other websites without obtaining consent from the author. Download presentation by click this link. If you encounter any issues during the download, it is possible that the publisher has removed the file from their server.
E N D
Presentation Transcript
Signal detection theory Nisheeth 7thFebruary 2019
Psychometric function Mathematical device Parametrically model relationship between stimuli features and observer response Yes/no 2AFC nAFC
Fitting psychometric functions Typically use a function of approximately sigmoid form Probit Sigmoid Weibull Modified by a lapse and a guess parameter (x) = + (1 - )F(x; , ) E.g. F = 1 exp(-(x/ ) ) Fit using least squares/ML Key psychometric parameters Slope Threshold Guess Lapse
Psychometrics summary Stimuli detection is stochastic Psychophysical calculations allow us to measure Bias Sensitivity Can also extend this basic principle to non- perceptual measurements We see how next
Signal detection theory Signal detection theory: A psychophysical theory that quantifies the response of an observer to the presentation of a signal in the presence of noise.
Signal detection theory Four possible stimulus/response situations in signal detection theory: Hit: Stimulus is present and observer responds Yes. Miss: Stimulus is present and observer responds No. False alarm: Stimulus is not present and observer responds Yes. Correct rejection: Stimulus is not present and observer responds No.
Key concepts Signal detection theory makes a distinction between an observers ability to perceive a signal and their willingness to report it. These are two separate concepts: Sensitivity Criterion
Key concepts Sensitivity: A value that defines the ease with which an observer can tell the difference between the presence and absence of a stimulus or the difference between stimulus 1 and stimulus 2. Criterion: An internal threshold that is set by the observer. If the internal response is above criterion, the observer gives one response. Below criterion, the observer gives another response.
What does the variance in response to stimuli mean? Mixed selectivity of stimulus-neuron mapping Stimuli Neuron Stimuli to neuron mapping is many-to-many, so for any one stimulus, multiple neurons will respond to varying degrees http://www.sciencedirect.com/science/article/pii/S0959438816000118?via%3Dihub
ROC Receiver operating characteristic (ROC): In studies of signal detection, the graphical plot of the hit rate as a function of the false alarm rate. Chance performance will fall along the diagonal. Good performance (high sensitivity) bows out towards the upper left corner.
ROC Plotting the ROC curve allows one to predict the proportion of hits for a given proportion of false alarms, and vice-versa. Changes in criteria move performance along a curve but do not change the shape of the curve. Application: we want to figure out how good radiologists are in looking for tumors in CT scans
Tumor perception Internal responses will have some variability because of mixed neuronal selectivity Criterion for deciding if there is a tumor present in a scan will determine classification performance
Criterion shift affects performance Conservative criterion low false alarm rate, low hit rate Aggressive criterion high hit rate, high false alarm rate
SDT tries to disambiguate D measures sensitivity Estimated as z(HR) z(FAR) C measures criterion Calculated as -0.5[z(HR) + z(FAR)] https://www.birmingham.ac.uk/Documents/college-les/psych/vision- laboratory/sdtintro.pdf
D calculation D = z(HR) z(FAR). Assume N(0,1) for numerical calculation nobias.png
C calculation C = midpoint between z(HR) and z(FAR) nobias.png
Example HR = 0.84, FAR = 0.16 D = z(0.84) z(0.16) = 1 (-1) = 2 C = 0 HR = 0.5, FAR = 0.023 D = z(0.5) z(0.023) = 0 (-2) = 2 C = [z(0.5) + z(0.023)]/2 = 1 (bias for saying no) Same information present for both decision-makers


")
")
")