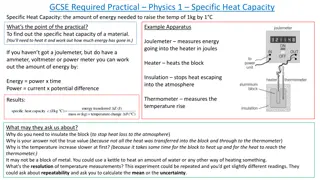
Essential Practical Skills for A Level Physics: Recording Data & Rules

Enhance your practical skills in A Level Physics by mastering data recording techniques and understanding the rules for results tables and graphing. Improve your precision, accuracy, and presentation of experimental data through clear guidelines provided in the resources.

Download Presentation

Please find below an Image/Link to download the presentation.
The content on the website is provided AS IS for your information and personal use only. It may not be sold, licensed, or shared on other websites without obtaining consent from the author. Download presentation by click this link. If you encounter any issues during the download, it is possible that the publisher has removed the file from their server.
E N D
Presentation Transcript
Y11 Thinking about A Level Physics! Welcome to presentation 2! What to expect from these resources: A taste of what the content will look like Clear structure to prepare for learning next year and help you Bridge the Gap from GCSE to A Level! Learning goal What is A Level Physics About?! Prior knowledge Application Combined or Triple Physics Begin to prepare for the transition from GCSE to A Level using independent study resources better hope brighter future
Presentation 2: Essential Practical Skills for A Level Physics better hope brighter future
Recording Data Increased significant figures A calculation answer cannot have more significant figures than the numbers used in it. Here the average has more s.f. than the repeats. Inconsistent precision - Each measurement should be made to the same level of precision. Missing units - Every column heading must have units. (ms-1) Incorrect mean The mean should be calculated ignoring any anomalies. Spot the 4 deliberate mistakes in the results table - (HINT - Only 1 mistake is a type of calculation error) Going deeper How could the table be improved further? Can you write a set of table rules? better hope brighter future
Rules for Results Tables 1. Tables should have clear headings with units indicated using a distinguishing mark before the unit, e.g. / or () 2. It is good practice to draw a table before an experiment commences and then enter data straight into the table. a. This may mean that you record results in an non-ascending or descending order which is fine when working in a lab book. b. If you were to present the table or to use it to identify patterns, rewriting in ascending or descending order after the experiment would be helpful. 3. The independent variable should be in the left hand column. 4. The body of the table should not contain any units 5. Data within a column should be recorded to the same number of decimal places which is determined by the resolution of the measuring instrument used. 6. Any data which is a calculation from other data in the table should not be recorded to more significant figures. Adapted from AQA Practical Skills Handbook. Going deeper - What is the uncertainty in your measurement? This is determined by the resolution of your measuring instrument and could be recorded along with the heading and unit too! better hope brighter future
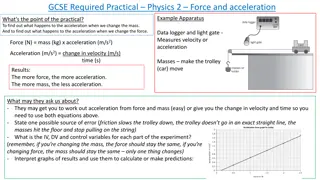
Rules for Graphing 1. Axis should be labelled with a unit which is separated by a distinguishing mark, e.g. / or () 2. Data points should only be plotted using x or +. 3. The plotted points should occupy as much of the graph paper as possible in both the x and y directions. a. Use at least half of the graph paper in both the x and y direction b. Use a sensible scale - multiples of 1,2,5,10,20,50 etc. c. Axis do not have to start at (0,0) but be careful if you need to work out the y-intercept. 4. A line of best fit should be drawn a. Use a thin pencil line b. Ignore anomalies and don t force it through every plotted point c. Have roughly the same number of points on either side d. Not all line of best fits go through the origin (0,0) so don t force it! Correct Incorrect better hope brighter future
Types of Error Random errors Systematic errors Unpredictable and vary from measurement to measurement. Random errors are always present. They cause readings to be spread around the true value. Their effects can be reduced by taking multiple repeated measurements and calculating a mean. A systematic error is the same for each measurement made. It occurs when there is a problem with the measuring instrument e.g. a zero error; or the observation technique e.g. reading the wrong scale; or a problem with the environment e.g. the experiment was not conducted at standard temperature and pressure. The whole experiment should be repeated using a different technique/instrument if a systematic error has occurred. better hope brighter future
WORK OUT THE ANSWERS! Sort the following into systematic and random errors: 1. Parallax error when measuring the meniscus on water in a measuring cylinder. 2. A faulty analogue ammeter that has a reading of 0.1A when it is not connected in a circuit. 3. Human reaction time error using a stopwatch to time the drop of a tennis ball from the ceiling to the floor. Going deeper: How would you resolve these errors? better hope brighter future
Finding the Gradient Hint: https://www.youtube.com/watch?v=ThiuJzMgxf8 When finding the gradient m of a line always show your working and always draw a triangle! The hypotenuse of the triangle should always be at least as big as half of the line of best fit. If the line of best fit is a curve, draw a tangent to the curve at the point where the gradient is required. The gradient m can be calculated by: m = change in y / change in x = y / x The unit for the gradient is the unit for the y-values divided by the unit for the x-values. better hope brighter future
WORK OUT THE ANSWERS! Graphing Challenge Add a random selected range to the x and y axis by rolling a dice. Don t worry about units! Create a line of best fit on your graph Measure the gradient (use a tangent for the curve). Don t worry about units! 1 0 to 100 2 0.001 to 0.010 3 2200 to 6700 4 0 to - 100 Going Deeper Sketch the graph with a large random error and suggest how it could be dealt with . Can you work out the y-intercept from your graph? 5 0 to - 0.025 6 10000 to 10010 better hope brighter future
Using the Equation of a Line ? = ??+? y= y variable x=x variables m= gradient c= y intercept Worked example: y-axis = current I x-axis = voltage V Equation with both : V = IR Re-arrange to make I subject: ? =1 1. Find a physics equation that matches the variables used in your experiment. 2. Re-arrange it into the form y=mx+c 3. Match up the values to determine what the gradient of your graph and the y- intercept represent ?? Match: ? = ?? + ? y-axis quantity x-axis quantity Gradient (m) I (Current) y-intercept (c) 0 Q (charge) T (time) a u2 v2 s better hope brighter future
WORK OUT THE ANSWERS! Summary Quiz 1. Calculate the mean of this set of data: 0.12, 0.14, 0.11 2. Define what is meant by a random error 3. State 4 rules for graphing 4. If a student had plotted a graph of force, applied F to a spring on the x-axis and extension e of the spring on the y-axis, what would the gradient represent? (F= ke) better hope brighter future
Summary Quiz Answers Calculate the average to this set of data: 0.12, 0.14, 0.11 0.12 Define what is meant by a random error. An error that is always present and varies from reading to reading causing a spread of results about a true value OWTTE. State 1 of the 4 rules for graphing. Axis should be labelled with a unit which is separated by a distinguishing mark, e.g. / or () Data points should only be plotted using x or +. The plotted points should occupy as much of the graph paper as possible in both the x and y directions. A line of best fit should be drawn If a student had plotted a graph of force, applied F to a spring on the x-axis and extension e of the spring on the y-axis, what would the gradient represent? (F= ke) 1/k 1. 2. 3. 4. better hope brighter future