Efficiency Investigation Through Bouncing Ball Experiment

Explore the efficiency of different types of balls by conducting a bouncing ball experiment. Measure bounce heights, calculate efficiency percentages, create a bar graph, and draw conclusions based on the results obtained. Understand the energy transformations involved in the bouncing process and compare the efficiency of each ball type to identify variations.

Download Presentation

Please find below an Image/Link to download the presentation.
The content on the website is provided AS IS for your information and personal use only. It may not be sold, licensed, or shared on other websites without obtaining consent from the author. Download presentation by click this link. If you encounter any issues during the download, it is possible that the publisher has removed the file from their server.
E N D
Presentation Transcript
Bouncing ball efficiency Investigation Bouncing ball efficiency Investigation
Aim: To perform an experiment to calculate the efficiency of different types of balls to bounce
Hypothesis It is predicted that the ______ ball will have the highest efficiency because
Method 1. Find a flat, hard surface next to a wall. Stand the ruler against the wall (attach with sticky tape) so that the 0cm touches the ground. 2. Hold the first ball so the top of the ball is exactly 1m above the ground. 3. Drop the ball without applying any force and record how high it bounces. 4. Repeat these steps four more times with the same ball (trials 2,3, 4 and 5). 5. Repeat steps 4 and 5 for the other types of balls.
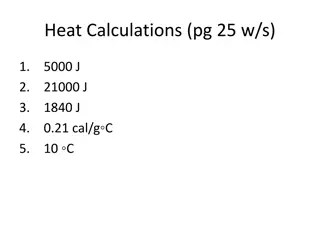
Results Results Ball Bounce Height (m) Average bounce height (m) Bounce efficiency (%) (Average Bounce height / drop height) x 100 Trial 1 2 3 4 5 Tennis
Efficiency calculations Efficiency calculations Average = sum of the trials/number of trials Bounce efficiency = bounce height/drop height x 100
Graphing : Graphing : You are now to draw a graph of bounce efficiency against the type of ball dropped. This will be a bar graph Conclusion: Write a paragraph that compares the efficiency of each type of ball Explain why there are differences