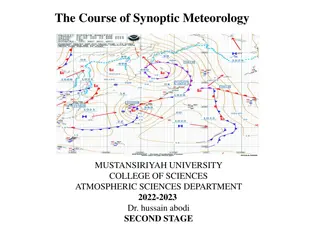
Insights into Northern Annular Mode and Atmospheric Oscillations

Explore the Northern Annular Mode and its impact on atmospheric patterns such as the jet stream and polar vortex. Learn about NAM/AO phases, SLP correlations, trends, ozone contributions, and historical data like Last Glacial Maximum. Dive into the Atlantic Multidecadal Oscillation and a global climate system oscillation. Discover key research findings and visual representations.

Download Presentation

Please find below an Image/Link to download the presentation.
The content on the website is provided AS IS for your information and personal use only. It may not be sold, licensed, or shared on other websites without obtaining consent from the author. Download presentation by click this link. If you encounter any issues during the download, it is possible that the publisher has removed the file from their server.
E N D
Presentation Transcript
Review: NAM/AO High/Positive phase: the jet is shifted towards higher latitude, the polar vortex is intensified, and cold air is walled off in the polar vortex. Low/Negative phase, the vortex is weaker, the jet is shifted southward, and cold air outbreaks are more common
Indices correlation between SLP at each grid point and: 1. the two-point Portugal - Iceland NAO index (i.e., SLP in Iceland minus SLP in Portugal) 2. Lorenz's U55 index: averaging [u] at 55N (U55) 3. leading EOF of SLP
NAM vs NAO indices
Trends in NAM? Wallace 2000
Vertical structure Trend AO contribution Wallace 2000
Ozone trends The AO contribution bears a strong spatial resemblance to the total trend, and accounts for about half of its amplitude and much of its spatial structure. Wallace 2000
NAM during Last Glacial Maximum? Pre-Industrial Control Last Glacial Maximum 250 hPa wind maxima as function of latitude for DJF daily u-wind over 20 years (essentially a 2D distribution of the jet core) Courtesy of M. L fverstr m
An oscillation in the global climate system of period 65-70 years Superimposed on the warming, global-mean surface temperature records display variability on timescales of a century or less Identify a temperature oscillation with a period of 65-70 years in the global temperature record Observation and model simulations suggest that this oscillation arises from predictable internal variability in the ocean-atmosphere system Schlesinger and Ramankutty 1994
AMO definition 0 N to 60 N, 75 W to 7.5 W 1) Average Atlantic SST anomalies north of the equator (Enfield et al. 2001, right), where: a) the northern limit was kept at 60 N to avoid problems with sea ice changes b) data smoothed via 10- year running mean or other low-pass filter
Revised AMO 2) Rotated EOF1 of North Atlantic SST anomalies (Mestas-Nu ez and Enfield 1999) 3) As in (1) but detrended to remove warming signal (Trenberth and Shea 2006) (Trenberth and Shea 2006)
Differenced AMO 4) Difference between the observed and estimated forced historical NH temperature variations (i.e. observations minus model-estimated forced temperature) Figure 2. Time series of estimated unforced NH mean variability (annual series) and associated multidecadal Atlantic Multidecadal Oscillation (AMO) components (smooth curves) based on differenced-AMO (gray) vs. detrended-AMO (black) approaches applied to the observational Nh mean record, using (c) CMIP5-Full Mann et al. 2014
Impact on North American and European Climate Sea-level pressure Precipitation Temperature 1931 to 1960 (warm phase AMO) minus 1961 to 1990 (cool phase AMO) Sutton and Hodson 2005
Impact on NA precipitation +PDO, -AMO + PDO, +AMO -PDO, -AMO - PDO, +AMO McCabe et al. 2004
Impacts: Hurricane frequency + AMO decades favor Atlantic hurricanes (warm SSTs) Kerr 2005
Mechanisms Vellinga and Wu 2004
Mechanisms 1. Anomalous northward ocean heat transport associated with a strong phase of the Atlantic THC generates a cross- equatorial SST gradient. 2. ITCZ to moves to a more northerly position with increased strength. 3. Extra rainfall resulting from the anomalous ITCZ imposes a freshwater flux and produces a salinity anomaly in the tropical North Atlantic. 4. Sustained salinity anomalies slowly propagate toward the subpolar North Atlantic at a lag of 5 6 decades. 5. The accumulated low-salinity water lowers upper-ocean density, which causes the THC to slow down. 6. The oscillation then enters the opposite phase. Vellinga and Wu 2004
Mechanisms Vellinga and Wu 2004
2. 1. 1. Full cycle ~5-6 decades to complete 2.
Caveats That may be how the Hadley AMO works, says oceanographer Jochem Marotzke, but it doesn t settle the mechanism question. How a model generates multidecadal Atlantic variability seems to be dependent on the model you choose. K e
Other proposed mechanisms 1. Enhanced THC generates uniform positive SST anomalies in the North Atlantic. 2. SLP low that extends over the SSTs but also farther eastward over Eurasia 3. Weakened Aleutian low and associated positive SST anomalies Dima and Lohmann 2006
Other proposed mechanisms 4. local positive feedback amplifies these structures 5. After 10 15 yr, SLP max gradient over Fram Strait 6. Increases Arctic sea ice and freshwater export 7. AMOC is reduced due to resulting freshwater fluxes in the North Atlantic (10 20 yr) and the cycle is turned into its opposite phase Dima and Lohmann 2006
AMO & climate change?? What are the limitations of studying AMO, mechanisms, and its impacts over the instrumental period? What other records may we use to assess AMO variability? Model simulations? Mann et al. 2014
AMO & climate change?? Competition between a modest positive peak in the AMO and a substantially negative- trending PMO are seen to produce a slowdown or false pause in warming of the past decade. More on the so-called hiatus when we talk about the PDO! Steinmann et al. 2015
Abrupt climate change: Heinrich / DO events! Thursday!!
Exam results High: 96 Low: 68 Average: 81 5 point curve! High: 101 Low: 73 Average: 86
")