Wavelet-based Scaleograms and CNN for Anomaly Detection in Nuclear Reactors

This study utilizes wavelet-based scaleograms and a convolutional neural network (CNN) for anomaly detection in nuclear reactors. By analyzing neutron flux signals from in-core and ex-core sensors, the proposed methodology aims to identify perturbations such as fuel assembly vibrations, synchronized cluster vibrations, coolant flow oscillations, and coolant temperature oscillations. Data preprocessing involves detrending and signal segmentation for robust analysis. Feature extraction using Discrete Wavelet Transform (DWT) and mother wavelet selection lead to scaleogram generation, providing input to a Deep CNN architecture for classification. The model's performance is assessed through noise analysis, showcasing the methodology's effectiveness for reactor anomaly detection.

Download Presentation

Please find below an Image/Link to download the presentation.
The content on the website is provided AS IS for your information and personal use only. It may not be sold, licensed, or shared on other websites without obtaining consent from the author. Download presentation by click this link. If you encounter any issues during the download, it is possible that the publisher has removed the file from their server.
E N D
Presentation Transcript
Putting Together Wavelet-based Scaleograms and CNN for Anomaly Detection in Nuclear Reactors Thanos Tagaris, George Ioannou, Maria Sdraka, Georgios Alexandridis, Andreas Stafylopatis 2019 3rdInternational Conference on Advances in Artificial Intelligence (ICAAI 2019) October 26-28, Instabul, Turkey 1
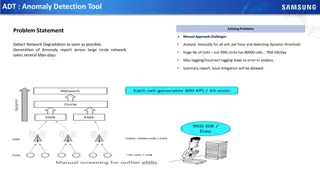
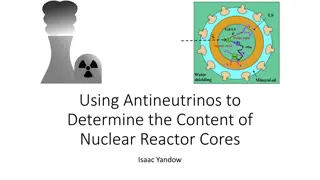
Main objectives Identify perturbations happening in a nuclear reactor from neutron flux signals captured by in-core and ex-core sensors. Using the DWT (Discrete Wavelet Transform) to produce meaningful features Imploring DNNs (Deep Neural Networks) to classify each signal to a perturbation Performing a noise analysis to prove the robustness of the proposed methodology 2
Data description The simulated data have been grouped in 4 categories (classes) regarding the type of perturbation that occurs in the reactor: 1. Fuel Assembly Vibrations 2. Cluster of Fuel Assemblies Vibrating Synchronously 3. Coolant Flow Oscillations 4. Coolant Temperature Oscillations 3
Data Preprocessing The signals have been detrended. Each signal is split into ? parts, ? {2,4,8}, for three reasons: 1. To test the minimum signal length that a perturbation can be detected 2. To produce more data for DNN training 3. To perform ? -fold cross-validation (? 1 parts for training, 1 for testing), to better assess the performance of the model 4
Feature Extraction DWT is performed on the signals to extract the coefficients. It is important to choose the best mother wavelet for the transformation. Two criteria were used to determine the best fit: 1. Cross-Correlation 2. Energy-to-Entropy After a voting scheme, rbio3.1 was selected as the best mother wavelet. 5
Feature Extraction After the wavelet transformation has been applied, scaleograms are produced for each signal. Scaleograms are 2-dimentional heatmaps, like spectrograms. Useful for illustrating the strength of a signal for each frequency and each timestep. Will be fed as input to the Deep Neural Network 6
Deep Neural Network Deep CNN (Convolutional Neural Network). Conv layer with 32 (11x11) filters Conv layer with 64 (5x5) filters Max Pooling layer (3x3) Dropout (? = 0.35) Fully Connected layer with 256 neurons Fully Connected layer with 4 neurons (due to 4 classes) Adam Optimizer was used. Loss function: Cross-entropy. 7
Results Mean accuracy for each category of detectors for various ? In-core detectors contain more information w.r.t. perturbation identification When ? increases, more data is produced for training and therefore the system exhibits better accuracy In-core Ex-core ? 2 98.04% 83.33% 4 99.63% 83.44% 8 99.85% 93.88% 8
Noise Analysis To assess the robustness of the model, noise was added to the signals. 10 different values of ??? have been ??????? ?????? considered ??? = When ??? < 1, performance deteriorates sharply. 9
Acknowledgement This project has received funding from the Euratom research and training programme 2014-2018 under grant agreement No 754316 We express our gratitude to the Paul Scherrer Institute (PSI), Switzerland, for supplying the data used in our experiments, within the framework of the aforementioned project 10
Thank you for your attendance! Any Questions? 11