Analysis of Inconsistent Data Issues in Homelessness Applications

The data reveals inconsistencies in the number of not offered applications in local authorities dealing with homelessness. Disparities exist between different regions, raising questions about local practices, definitions, and recording methods. Discrepancies also persist between HL2 and HL3 placements nationally. Explore the causes behind these discrepancies and potential implications for service provision.

Download Presentation

Please find below an Image/Link to download the presentation.
The content on the website is provided AS IS for your information and personal use only. It may not be sold, licensed, or shared on other websites without obtaining consent from the author. Download presentation by click this link. If you encounter any issues during the download, it is possible that the publisher has removed the file from their server.
E N D
Presentation Transcript
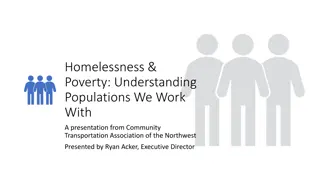
Not offered Data seems inconsistent some LAs that deal with large numbers of homelessness applications have lots of not offered, while others have very small numbers or none at all. Apr-Sep 2019 Applications 2,984 1,755 1,269 Not offered 1,540 175 45 Disproportionately large? Glasgow City Edinburgh Fife North Lanarkshire South Lanarkshire Dundee City West Lothian Aberdeen City Aberdeenshire Highland Disproportionately small? 1,109 0 1,083 796 767 738 637 601 <4 0 0 <4 0 50
Not offered Data seems inconsistent some LAs that deal with large numbers of homelessness applications have lots of not offered, while others have very small numbers or none at all. Apr-Sep 2019 Applications 2,984 1,755 1,269 Not offered 1,540 175 45 Edinburgh ~x1.5 more applications than Fife but x4 not offered Glasgow City Edinburgh Fife North Lanarkshire South Lanarkshire Dundee City West Lothian Aberdeen City Aberdeenshire Highland 1,109 0 1,083 796 767 738 637 601 <4 0 0 <4 0 50
Not offered Data seems inconsistent some LAs that deal with large numbers of homelessness applications have lots of not offered, while others have very small numbers or none at all. Apr-Sep 2019 Applications 2,984 1,755 1,269 Not offered 1,540 175 45 Glasgow City Edinburgh Fife North Lanarkshire South Lanarkshire Dundee City West Lothian Aberdeen City Aberdeenshire Highland Fife and Highland similar not offered, but Fife double applications 1,109 0 1,083 796 767 738 637 601 <4 0 0 <4 0 50
Not offered Data seems inconsistent some LAs that deal with large numbers of homelessness applications have lots of not offered, while others have very small numbers or none at all. Apr-Sep 2019 Applications 2,984 1,755 1,269 Not offered 1,540 175 45 Glasgow City Edinburgh Fife North Lanarkshire South Lanarkshire Dundee City West Lothian Aberdeen City Aberdeenshire Highland 1,109 0 1,083 796 767 738 637 601 <4 0 0 <4 0 50 Do the majority of LAs really manage to have 0 not offered ?
Why so different? Genuine differences in local provision or practice between areas that naturally lead to large variation in the number of not offered? If so, what are those differences? Different ways of recording/reporting the information between LAs? Are the definitions used consistent? E.g. do some include all types of presentations and others include only some e.g. those including/excluding out of hours? Something else e.g. IT issues in Edinburgh, recording issues in Glasgow
HL2 & HL3 Differences still exist between HL2 & HL3 Nationally, HL3 10% higher than HL2 (1,112 placements) this is higher than the 9% reported in the June 2019 publication and considerably higher than the 2% reported in the January 2019 publication Although, it s not always the case that the HL3 returns are higher 17 LAs HL3 returns were higher than their HL2, ranging from 2% to 64% 7 LAs HL3 return was lower than their HL2, ranging from 2% to 17% However, 4 LAs totals were exactly the same, with another 4 being extremely close
Reasons provided for differences HL3 return includes additional types of accommodation that are not included in HL2 Why are different definitions/sets of accommodation being reported across returns? Is this happening in other LAs that we aren t aware of? How consistent is the types of accommodation included between LAs for i) HL2 and ii) HL3? Cases not closed in HL3 returns How are the HL2 figures then derived, if not from HL3? What prevents the data in HL3 from being more up to date?
Those in TA a while not included in HL3 return Is there a reason that this should be the case? Is this happening in other LAs we aren t aware of? Can all/any of these differences explain why the differences between the two returns have gotten considerably larger in the last year? E.g. are more types of accommodation included in HL3/excluded from HL2? Are HL3 not being kept as up to date as they were before?
Less of an issue, but To flag that we still do not have 100% of HL3 returns with a corresponding HL1 return this was only the case for 1% (75) of HL3 returns affected 15 LAs, 2 of which had a difference in excess of 15% In which circumstances would there not be an HL1 return?
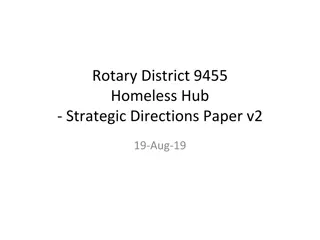
Failure to maintain 2019 April-June July - Sept Only completed for two thirds of applications. 1,138 567 1,590 1,144 587 1,614 Financial difficulties/ debt/ unemployment Physical health reasons Mental health reasons Unmet need for support from housing/ social work/ health services Lack of support from friends/ family Difficulties managing on own Drug/ alcohol dependency Criminal/ anti-social behaviour Despite guidance stating this is mandatory for all cases opened on or after 1 April 2007. 335 343 1,381 522 781 822 1,376 517 816 849 Some have selected Refused , but this is very few only. Not to do with applicant household (e.g. landlord selling property, fire, circumstances of other persons sharing previous property, harassment by others, etc) 2,777 2,756 108 101 Refused All completing this question Total applications Percentage completing this question Is it because of other reasons? 6,274 9,236 6,312 9,409 68% 67%
Use of other temporary accommodation Type of temporary accommodation (%) 2019 Change in recent quarters due to Edinburgh re-classifying B&B accommodation. Does this need a new category added? 2018 31-Dec 31-Mar 30-Jun 30-Sep Local authority furnished Local authority other Housing association 43.5 1.4 16.7 43.5 1.4 16.5 43.2 1.2 16.6 43.9 1.3 15.9 Any other categories we should add (proportion of other was relatively high pre-2019)? 6.9 8.1 9.9 1.1 12.5 6.8 7.7 10.3 1.1 12.7 6.9 7.7 5.9 1.2 17.3 7.1 6.7 6.2 1.1 17.7 Hostel: Local authority Hostel: Other Bed & Breakfast Womens refuge Other Affects other tables also e.g. those entering and exiting TA by accommodation type.
Use of other - outcome Outcome for closed cases 2019 (%) Other is higher than all categories except LA tenancy and RSL. Jan - March April-June July - Sept LA tenancy RSL (Housing Association) Private rented tenancy 44 26 43 28 42 28 Any other categories we should add? 5 1 5 1 5 1 Prior suggestion of deceased , although not necessarily straightforward. E.g. if it s a household with more than one member, and not all are deceased. Hostel Returned to previous/ present accommodation Moved-in with friends/ relatives Other (known) Not Known (Contact maintained) 5 5 5 5 8 4 7 5 8 7 6 6
Use of other last action This question ask what the last action of the local authority was prior to discharge of duty Particularly useful in seeing where a local authority has referred an application to another local authority. The question includes a number of options, but none of the other options is selected in around 28% of cases. Why is this?
LASTACT Applicant offered LA or RSL Scottish Secure Tenancy within LA - Accommodation taken up None of the other responses Applicant offered temporary accommodation, advice and assistance - Accommodation taken up Applicant offered LA or RSL Scottish Secure Tenancy within LA - Accommodation not taken up Applicant offered advice and assistance only (including measures to retain previous accommodation) Applicant offered private sector Assured Tenancy - Accommodation taken up Applicant offered temporary accommodation, advice and assistance - Accommodation not taken up Applicant offered interim accommodation under the Interim Accommodation Regulations - Accommodation taken up Applicant referred to other LA (under 87 Act) Applicant offered short Scottish Secure Tenancy under paragraph 5A of schedule 6 of the 2001 Act - Accommodation taken up Applicant offered short Scottish Secure Tenancy (other than below) -Accommodation taken up Applicant offered short Scottish Secure Tenancy (other than below) - Accommodation not taken up Applicant offered private sector Assured Tenancy - Accommodation not taken up Applicant offered interim accommodation under the Interim Accommodation Regulations - Accommodation not taken up Applicant offered short Scottish Secure Tenancy under paragraph 5A of schedule 6 of the 2001 Act - Accommodation not taken up Applicant offered Short Assured Tenancy under regulation 5 of The Homeless Persons (Provision of Non- Permanent Accommodation) (Scotland) Regulations 2010 Accommodation taken up Applicant offered section 7 tenancy with support - Accommodation taken up Applicant offered Short Assured Tenancy under regulation 5 of The Homeless Persons (Provision of Non- Permanent Accommodation) (Scotland) Regulations 2010 - Accommodation not taken up N 9147 51% 5071 28% 1016 6% 830 5% 647 4% 472 3% 300 2% % 167 1% 89 0% 30 0% 18 0% 11 0% 9 0% 8 0% 8 0% 4 0% 3 0% 2 0%
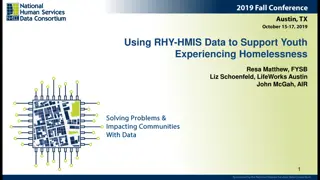
Postcode This questions ask the postcode of the last settled accommodation of the applicant household. We are hoping to use this data in future for more geographical analysis, including linking to SIMD. A valid postcode is provided in around 75% of cases, though with significant variation across local authorities.
Percentage of cases where a valid postcode has been provided 0% 10% 20% 30% 40% 50% 60% 70% 80% 90% 100% Moray Angus South Ayrshire Clackmannanshire North Lanarkshire Aberdeenshire North Ayrshire Inverclyde East Lothian Orkney Highland East Renfrewshire West Lothian Stirling Edinburgh East Ayrshire East Dunbartonshire Dundee City West Dunbartonshire Dumfries & Galloway Aberdeen City Argyll & Bute South Lanarkshire Perth & Kinross Eilean Siar All Renfrewshire Scottish Borders Fife Glasgow City Midlothian Falkirk Shetland
National Insurance Number We collect the national insurance number of the main applicant (and their partner if applicable). Used in identifying repeat applicants Also vital for any future data linkage projects Currently around 89% of cases have a valid NI number for the main applicant.
Percentage of cases where the NI number was provided for the main applicant 0% 10% 20% 30% 40% 50% 60% 70% 80% 90% 100% Aberdeen City East Ayrshire Perth & Kinross West Lothian North Lanarkshire East Lothian West Dunbartonshire South Ayrshire East Dunbartonshire Moray Dumfries & Galloway Highland Fife Dundee City Edinburgh Angus East Renfrewshire South Lanarkshire Falkirk Midlothian Renfrewshire Clackmannanshire North Ayrshire Argyll & Bute All Stirling Eilean Siar Inverclyde Scottish Borders Shetland Glasgow City Orkney Aberdeenshire
Additional HL3 questions Introduced 2 additional questions to HL3 last year These related to whether the temporary accommodation placement included a pregnant women or children Many local authorities have implemented these additional questions, but not all We require the questions to be sent to us for the 2020/21 financial year, which means the April to June quarter collected in July.
Does the data we collect meet needs? Are the questions we ask collecting The information we need? Do we need to review the content of our collections? Are there gaps? Do we collect things no-one needs? High quality data (consistent, comparable, not lots of other )? Are the definitions we use correct e.g. Repeat homelessness Settled accommodation Social rent
Suggested Approach For review of collection (question wording, category options, definitions etc.) form a working group of SG and external data providers / stakeholders with expertise to work through each question to determine improvements and changes. Does this sound sensible? Any other suggestions?
Dissemination Are the publications useful? What elements are used e.g. text, tables, charts? Is the frequency right? Do we need both the 6-monthly and annual publications? Do we need more frequent, e.g. quarterly publications? What else would be useful e.g. theme reports, bespoke topic analysis?
Collection frequency We currently collect data 4 times a year, but publish only twice a year. Could we collect only every 6 months to tie in with publications? Would that be beneficial to LAs by freeing up time, or would it likely cause issues?
Alternative data collection tool Consideration to use ProcXed (current tool for PREVENT1) for HL data collections also. Provides in-built validation Speed up finalisation of data reduce back and forth etc. Much more flexibility around changes to data collection Dedicated ICT team to support this How easy or difficult would it be for LAs to supply HL data returns via ProcXed? What would be the main problems / issues / concerns with moving to this? What use is made of the SG generated reports for 1) QA and 2) internal LA reporting?
How quickly can changes be implemented? Fundamental changes to the data collected, such as a suite of new questions on a topic, would take time to develop and implement therefore be considered long-term changes. Changes to data collection tools would also be long-term. Changes which could be accommodated relatively easily, such as a new category within an existing question or a single straight-forward question, would be considered short-term changes. Timings will also depend on whether or not consultation is required e.g. changes to definitions. Resource is limited, both within LAs and SG!
Other timing considerations Sensible to move to a new tool in Q1 or Q3 as there is no publication that immediately follows these collection periods. Q1 would make most sense as: A longer lead in time than Q3 for publication Provides a consistent data collection for a whole year How this interacts with other change e.g. to content or collection / publication frequencies. Does it make sense to make all changes at once, or adopt a phased approach? ProcXed development and testing timescales - TBC Lead in times for LAs to make changes what are these?
Next steps Consider feedback from today and what further information and work is required to take this forward Determine priorities for changes and sequencing of implementation Construct realistic timelines