Analysis of State-owned Commercial Banks Ownership Patterns
Data analysis of ownership histories for over 27,000 commercial banks in 184 countries from 1995-2018, focusing on state-owned banks. The study reviews state ownership trends, correlations with bank performance, industry-level evidence, and lending to governments. The research also delves into performance indicators, liquidity creation, credit cyclicality, and characteristics of privatized and nationalized banks.

Download Presentation

Please find below an Image/Link to download the presentation.
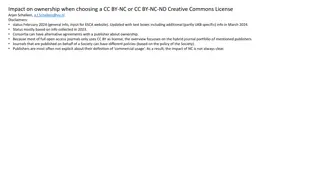
The content on the website is provided AS IS for your information and personal use only. It may not be sold, licensed, or shared on other websites without obtaining consent from the author. Download presentation by click this link. If you encounter any issues during the download, it is possible that the publisher has removed the file from their server.
E N D
Presentation Transcript
State-owned Commercial Banks Ugo Panizza The Graduate Institute Geneva & CEPR 1st Annual Central Bank Conference on Development Economics in the Middle East and North Africa December 1 2, 2021
Data New dataset with ownership histories for 27,245 commercial banks in 184 countries over 1995-2018 The panel is unbalanced but, 16% of banks have information for the full period (24 years), 52% for at least 20 years, 81% for at least 10 years, and 95% for at least 5 years I work with unconsolidated data (could also work with consolidated) Unique hand-coding of ownership histories (hundred of hours of work) Also thanks to Pietro Calice and Oliver Masetti for data on privatization Focus on commercial banks (not development banks), Islamic banks are also excluded from the sample Data for 317 development banks are also available but not used in the analysis
Outline Patterns on state ownership of commercial banks Macro Correlations Performance Industry-level evidence
What is not here (but is in the paper) More Performance Indicators (Net interest margins, Int expenditure, Int. revenues, year bu year analysis..) Liquidity creation Credit cyclicality and levels of debt Credit cyclicality and fiscal policy Characteristics of Privatized and Nationalized Banks Firm-level evidence More industry-level evidence
Outline Patterns on state ownership of commercial banks Macro Correlations Lending to the government Performance Industry-level evidence
State ownership across time and space Share of state-owned banks (a bank is defined as state-owned if the government owns at least 20% of it) Simple average Weighted average (weights add to 1 at the country-year level) Weighted average including development banks (weights add to 1 at the country-year level)
State ownership across time and space Share of state-owned banks (a bank is defined as state-owned if the government owns at least 20% of it) Simple average Weighted average (weights add to 1 at the country-year level) Weighted average including development banks (weights add to 1 at the country-year level)
State ownership across time and space Share of state-owned banks (a bank is defined as state-owned if the government owns at least 20% of it) Simple average Weighted average (weights add to 1 at the country-year level) Weighted average including development banks (weights add to 1 at the country-year level)
State ownership across time and space Share of state-owned banks (a bank is defined as state-owned if the government owns at least 20% of it) Simple average Weighted average (weights add to 1 at the country-year level) Weighted average including development banks (weights add to 1 at the country-year level)
Outline Patterns on state ownership of commercial banks Macro Correlations Performance Industry-level evidence
State-owned banks and financial depth Table 6: State-Owned Banks and Financial Depth (Dep. Var: Credit to the Private Sector) (1) (2) (3) (4) GOBt-5 -0.043** -0.043 -0.025 -0.056 (0.021) (0.033) (0.034) (0.050) PRIVY t-5 0.944*** 0.862*** 0.860*** 0.854*** (0.024) (0.039) (0.054) (0.049) ln(Y_PC) t-5 0.040*** 0.047*** 0.022* (0.009) (0.012) (0.012) C Rights t-5 -0.002 0.008* 0.001 (0.003) (0.005) (0.006) ln(INFL) t-5 -0.0001* -0.0001* -0.0001 (0.00002) (0.00002) (0.001) ENG 0.019 -0.010 (0.025) (0.028) GER 0.028 -0.038 (0.041) (0.047) SCAND 0.232* -0.053 (0.118) (0.097) SOC 0.051* -0.045 (0.029) (0.037) Const. 0.091*** -0.223*** -0.326*** -0.070 (0.014) (0.063) (0.088) (0.096) N. Obs 0.091*** -0.223*** -0.326*** -0.070 R2 (0.014) (0.063) (0.088) (0.096) N. Obs 2,818 2,407 1,371 1,036 N. Countries 170 164 148 159 Sample All All Y<2012 Y>2011 (5) -0.605*** (0.196) 0.634*** (0.088) 0.026 (0.096) -0.016 (0.011) 0.010 (0.015) 0.152** (0.067) 0.102 (0.094) 0.146 (0.103) 0.234 (1.036) 0.234 (1.036) 397 28 AE (6) 0.012 (0.026) 0.912*** (0.034) 0.017*** (0.006) 0.005 (0.003) -0.0001** (0.00002) -0.018 (0.015) 0.014 (0.030) 0.025 (0.023) 0.011 (0.018) -0.087* (0.048) -0.087* (0.048) 2,010 136 EMDE (7) 0.035 (0.056) 0.886*** (0.052) 0.026** (0.012) 0.003 (0.007) -0.0001* (0.0005) 0.025 (0.036) 0.044 (0.046) 0.016 (0.033) -0.175 (0.115) -0.175 (0.115) 783 47 MIC (8) 0.015 (0.033) 1.115*** (0.074) 0.010 (0.011) 0.004 (0.004) -0.0001 (0.0001) -0.030 (0.019) -0.009 (0.027) -0.049 (0.081) -0.049 (0.081) 601 37 LIC
Financial depth and state-owned banks Table 8: State-Owned Banks and Financial Depth (Dep Var: Share of State-Owned Banks) (1) (2) (3) (4) PRIVY t-5 0.026** 0.024* 0.040** 0.021 (0.010) (0.014) (0.020) (0.015) GOB t-5 0.778*** 0.789*** 0.766*** 0.810*** (0.032) (0.031) (0.034) (0.049) ln(Y PC) t-5 -0.004 -0.005 -0.001 (0.006) (0.007) (0.008) C Rights t-5 0.002 0.001 -0.002 (0.002) (0.003) (0.003) ln(INFL) t-5 -0.001*** -0.001*** 0.001 (0.0003) (0.0003) (0.001) ENG 0.011 -0.027* (0.015) (0.015) GER -0.022 -0.025 (0.027) (0.015) SCAND 0.049 -0.031 (0.053) (0.029) SOC 0.024 0.015 (0.038) (0.021) Const. 0.016** 0.047 0.042 0.051 (0.008) (0.047) (0.054) (0.074) N. Obs. 2,994 2,581 1,365 1,111 R2 0.709 0.719 0.736 0.744 N. Obs. 2,994 2,581 1,375 1,206 N. countries 169 161 146 161 Sample All All Y<2012 Y>2011 (5) 0.032 (0.027) 0.689*** (0.117) 0.014 (0.052) 0.002 (0.004) 0.006 (0.003) -0.058 (0.035) -0.017 (0.027) -0.027 (0.038) -0.133 (0.555) 430 0.536 433 28 AE (6) 0.031 (0.023) 0.784*** (0.034) -0.000 (0.007) 0.000 (0.003) -0.001*** (0.0003) 0.001 (0.014) -0.034* (0.020) 0.083*** (0.021) 0.024 (0.027) 0.015 (0.053) 2,046 0.752 2,148 133 EMDE (7) 0.024 (0.027) 0.848*** (0.041) -0.006 (0.014) 0.006 (0.004) -0.001*** (0.0003) -0.014 (0.027) -0.035* (0.019) 0.014 (0.049) 0.052 (0.140) 838 0.785 840 47 MIC (8) 0.023 (0.072) 0.771*** (0.038) 0.008 (0.019) 0.000 (0.003) 0.001 (0.001) 0.015 (0.022) 0.009 (0.026) -0.053 (0.135) 634 0.785 644 37 LIC
State-owned banks and GDP growth Table 12: State-Owned Banks and GDP Growth (Dep. Var: per capita GDP growth, 5-year average) (1) (2) (3) (4) ln(Y PC) t-5 -0.893*** -1.488*** -0.915*** -1.847*** -0.033 (0.235) (0.436) (0.250) (0.382) GOB t-5 1.607** 1.289 1.585** 2.525*** (0.671) (0.826) (0.716) (0.921) PRIVY t-5 -0.019 -1.126*** 0.066 -0.029 (0.217) (0.268) (0.243) (0.328) EDU t-5 1.934*** 3.240*** 1.985*** 3.492*** (0.562) (1.065) (0.588) (0.902) Gov Cons t-5 -0.756* -1.939*** -0.559 0.895 (0.427) (0.481) (0.539) (0.775) Open t-5 0.320 0.586*** 0.052 0.222 (0.205) (0.199) (0.325) (0.487) Ln(INF) t-5 -0.002*** -0.115** -0.002*** -0.012 (0.001) (0.042) (0.001) (0.007) Constant 6.767*** 12.705*** 7.625*** 8.727*** (1.975) (4.410) (2.324) (2.858) N. Obs 2,171 437 1,734 741 R2 0.149 0.230 0.126 0.285 N. Countries 134 28 106 44 Sample All AE EMDE MIC Country FE No No No No Robust standard errors in parenthesis, clustered at the country level. *** Statistically significant at the 1% level, ** Statistically significant at the 5% level, * Statistically significant at the 10% level (5) (6) -5.559*** -7.178*** -5.469*** -6.244*** -4.219*** (0.957) (1.847) (1.005) -0.033 2.495 -0.219 (0.578) (1.892) (0.557) -0.564** -1.241** -0.479 (0.271) (0.495) (0.296) 7.048*** -0.083 7.234*** (1.378) (2.784) (1.475) 0.690 1.427 0.658 (0.583) (1.853) (0.598) 0.572 2.626* 0.512 (0.461) (1.496) (0.476) -0.003*** -0.002* -0.133*** -0.002* (0.001) (0.001) (0.035) 6.612 (5.734) 460 2,171 437 0.142 30 134 28 LIC All AE No Yes Yes (7) (8) (9) (10) (0.718) 1.026 (0.841) -0.022 (0.377) 0.165 (0.605) -1.896** (0.866) 0.144 (0.488) (1.795) 0.757 (0.868) -0.702 (0.445) 8.637*** (2.185) 2.501* (1.325) 2.126* (1.207) -0.020*** -0.001** (0.005) 741 44 MIC Yes (1.427) -1.348 (1.231) -0.127 (0.606) 5.053 (3.192) -0.476 (0.971) 0.435 (0.406) (0.001) 1,734 106 EMDE Yes (0.000) 460 30 LIC Yes
State-owned banks and banking crises Table 14: State-Owned Banks and Banking Crises, Logit model (Dep. Var: Banking Crisis Dummy) (1) (2) GOB t-1 -3.773*** -4.469*** (0.863) (0.956) GOB 0.708 0.622 (1.326) (1.442) GOB t+1 3.033*** 3.482*** (0.940) (1.033) MIC 0.825*** (0.296) LIC -0.585 (0.497) GFC Constant -4.269*** -4.426*** (0.171) (0.240) N. Obs. 3,670 3,670 Pseudo R2 0.02 0.05 Robust standard errors in parenthesis, *** Statistically significant at the 1% level, ** Statistically significant at the 5% level, * Statistically significant at the 10% level (3) -4.439*** (1.127) 0.813 (1.464) 3.380*** (1.174) 0.798** (0.310) -0.569 (0.471) 1.826*** (0.284) -5.011*** (0.275) 3,827 0.11 (4) -6.109*** (1.197) 1.662 (2.835) 3.589 (3.449) CONTROLS 2.377*** (0.684) 0.603 (1.113) 1.212*** (0.459) -6.040* (3.360) 2,133 0.24
Outline Patterns on state ownership of commercial banks Macro Correlations Performance Industry-level evidence
Performance Baseline specification: ??,?,?= ?????,?,?+ ??,?,?? + ?? + ??,?,? Where ??,?,? is a performance indicator for bank i, in country c, in year t ROA; Net Interest Margin; Interest Income/assets; Interest Expenditure/assets; NPL/Loans; Provisions/Assets ??,?,?is a matrix of bank level controls Log(assets); non-interest income/assets; customer deposits/assets; Loan/assets fe is a set of fixed effects Country-year fixed effects (not country & year), bank type fixed effects (credit union, savings bank, cooperative bank, ) Standard errors are clustered at the bank-level 100s of regressions, I will show graphs for ? (tables with full set of results are available)
Profitability (ROA) No difference in AEs (but lower profitability after the European debt crisis) Lower in MICs (driven by ECA and 2000 and 2009) and LICs (but only marginally significant in the latter group of countries) MIC Effect driven by pre-GFC period No aggregate effect post-GFC, but lower profitability in ECA and higher in EAP
NPLs/Assets Higher for state-owned banks everywhere, but especially so in LICs NPL especially high in LAC, SAS, and SSA before GFC and in South Asia post GFC
Lending to the government (govt bonds/assets) State-owned banks hold more government bonds than other commercial banks. The effect is particularly large in MICs before GFC and in AEs and LICs post GFC Large effects in ECA, LAC, EAP (pre-GFC), and MNA (post GFC), lower holding in SAS post GFC
Lending to the government Note that the model has changed (less controls but bank FE; so different interpretation of SOE) Large effects in MIC, driven by EAP and LAC, negative effect in AE. Not statistically significant in LIC Note that, there is crowding out at the bank-level. Banks that lend more to the government have slower loan growth (in absolute value), but this effect is not larger for GOB (results available).
Outline Patterns on state ownership of commercial banks Macro Correlations Performance Industry-level evidence
Industry-level evidence I use UNIDO data for the manufacturing sector and the Rajan and Zingales approach to test whether industrial sectors with certain characteristics do relatively better in countries with a larger share of state-owned banks and whether this effect differs across normal and bad times Bad Times are years in which real GDP growth is 20% below average growth (if average growth is 5%, I define as bad times years for which growth is below 4%) or unemployment is 20% above average (if average unemployment is 5%, I define bad times as a years in which unemployment is above 6%) I use industry-level data for up to 114 countries over 1993-2017 aggregated at the 29 three digit-level used by Rajan and Zingales (without extra 4 digits classification used by RZ) I use the following industry characteristics: Labor intensity (employment over value added, with different values for high-income, middle-income, and low income countries) Human capital intensity (employment over value added, with different values for high-income, middle-income, and low income countries) External financial dependence (as in RZ) computed over 1987-2006 for US industries Presence of small firms as captured by employment share of firms with less than 20 workers in US industries 1. 2. 3. 4.
Industry-level evidence I estimate the following model ?????,?,?= ?ln ???,?,? 1 + ???(? ????,?+ ????,?+ ?????,? ???,?) +?? + ?? + ?? + ??,?,? Where ?????,?,? is value added growth in country c, industry i, year t, VA is value added, IC is an industry characteristic, SOE is the share of state-owned banks, BT is a bad times dummy, cy, ci, and iy are country-year, country-industry, industry-year fixed effects. Standard errors are double clustered at country and industry level.
Labor intensity On average, labor-intensive industries grow at a slower pace in countries with higher presence of state-owned banks, but this difference disappears during bad times
Small firms Industries with small firms do relatively better in countries with SOE during bad times, but this effect is only significant in advanced economies
Conclusions There are opposite views on the role of state-owned banks. I find no evidence that state-ownership of bank predicts financial depth, economic growth or the likelihood of financial crises Recent data show decreasing profitability gaps between state-owned and private banks However, state-owned banks tend to have more non-performing loans State-owned bank may contribute to macroeconomic stabilization, especially in countries where fiscal policy is procyclical. There is substantial heterogeneity both across countries and across time Future research should focus on understanding the drivers of this heterogeneity
State-owned Commercial Banks Ugo Panizza The Graduate Institute Geneva & CEPR 1st Annual Central Bank Conference on Development Economics in the Middle East and North Africa December 1 2, 2021


")


")

")