Understanding Mechanical Quality Factor of Cryogenic Silicon


Mechanical Quality
Factor of Cryogenic
Silicon
Marie Lu
Mentor: Nicolas Smith

Overview
•
Background
•
Fluctuation-Dissipation Theorem and Applications
•
Making Measurements
•
Experimental Design
•
Theoretical Predictions
•
Results
•
Future plans
Background
•
Future LIGO detectors
Future LIGO detectors
•
Cryogenic silicon replace silica for test masses
Cryogenic silicon replace silica for test masses
•
Minimizes thermal elastic noise. Coefficient of the thermal
Minimizes thermal elastic noise. Coefficient of the thermal
expansion goes to 0 at 120K
expansion goes to 0 at 120K
•
Need to understand behavior of noise spectrum produced by
Need to understand behavior of noise spectrum produced by
silicon.
silicon.
•
Difficult to detect tiny thermal fluctuations
Difficult to detect tiny thermal fluctuations
•
Saved by the Fluctuation Dissipation Theorem!
Saved by the Fluctuation Dissipation Theorem!
Fluctuation-Dissipation
Theorem
Relates noise spectrum + system’s linear responses to applied
Relates noise spectrum + system’s linear responses to applied
perturbations:
perturbations:
Power spectrum of noise
Applications
•
Note that our equation depends on one unknown, φ, the loss
angle:
•
We will show that φ is related to the quality factor Q.
•
Q = dimensionless, a description of how under-damped an
oscillator is.
Q and φ
•
By definition,
If we derive from the equation of motion,
we find that
and
Measuring Q
•
Thus we have a relationship between Q and φ.
•
By measuring Q, we can find the power spectrum.
•
How?
•
Method 1: Ring down
•
Method 2: Transfer function
•
Method 3: Control loops (Future)
Phase locked loop
Amplitude locked loop
Reducing clamp loss
•
Important to reduce clamp loss in order to measure true loss
of silicon
where R = strain energy ratio = E
steel
/(E
steel
+E
Si
)
φ ≈ φ
Si
+ Rφ
Steel
Clamp and Wafer Design
C
R
Y
O
S
T
A
T
D
D
E
E
S
S
I
I
G
G
N
N
Obtaining φ
Results
241.5 Hz Mode: 296K,
Q = 2784, Error = 6.2
Analysis
•
Results indicate that clamp loss is still dominant
•
To improve clamp, reduce strain energy lost in steel.
•
We focused on clamp shapes and dimensions before
•
Now we look into wafer design
1) Reduce wafer thickness.
2) Decrease cantilever width
3) Simplify the geometry.
Geometry might be why the 241.5 Hz
mode had less loss than the 242 Hz
mode. Use higher order modes too?
Frequency (Hz)
Strain Energy Ratio
Frequency (Hz)
Frequency (Hz)
4) Study oscillation of the flaps rather
than cantilevers
Strain Energy Ratio
Strain Energy Ratio
Future Work
•
Improve our current experimental design until we can measure a
maximum Q
≈ 10
8
or better.
•
Implement the control loops to continuously measure Q
•
Understand changes in Q with temperature and frequency
•
Then study the changes in Q of the silicon due to thin film
deposition.
•
Films will be for controlling reflectivity of masses.
•
There could be deformations due to thin film deposition
•
Additional sources of loss between
•
How the curvature will affect laser reflectivity.
Acknowledgements
•
Thanks to my mentor Nic Smith
•
To Professor Rana Adhikari, Zach Korth, Professor
Weinstein, NSF
•
Everyone in the subbasement lab for being so helpful
•
Fellow SURFs who made my summer so much fun!
Questions?
This presentation explores the Mechanical Quality Factor of Cryogenic Silicon, detailing its significance in improving LIGO detectors by minimizing thermal elastic noise. The Fluctuation-Dissipation Theorem is discussed, showing how it relates noise spectrum to linear system responses. Methods for measuring the Quality Factor are reviewed, along with strategies for reducing clamp loss and optimizing wafer design to enhance accuracy in measurements.

Download Presentation

Please find below an Image/Link to download the presentation.
The content on the website is provided AS IS for your information and personal use only. It may not be sold, licensed, or shared on other websites without obtaining consent from the author. Download presentation by click this link. If you encounter any issues during the download, it is possible that the publisher has removed the file from their server.
E N D
Presentation Transcript
Mechanical Quality Factor of Cryogenic Silicon Marie Lu Mentor: Nicolas Smith
Overview Background Fluctuation-Dissipation Theorem and Applications Making Measurements Experimental Design Theoretical Predictions Results Future plans
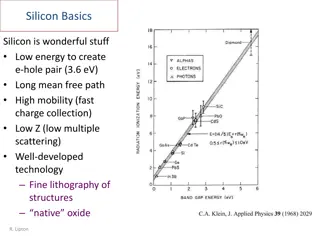
Background Future LIGO detectors Cryogenic silicon replace silica for test masses Minimizes thermal elastic noise. Coefficient of the thermal expansion goes to 0 at 120K Need to understand behavior of noise spectrum produced by silicon. Difficult to detect tiny thermal fluctuations Saved by the Fluctuation Dissipation Theorem!
Fluctuation-Dissipation Theorem Relates noise spectrum + system s linear responses to applied perturbations: Power spectrum of noise
Applications Note that our equation depends on one unknown, , the loss angle: We will show that is related to the quality factor Q. Q = dimensionless, a description of how under-damped an oscillator is.
Q and By definition, If we derive from the equation of motion, we find that and
Measuring Q Thus we have a relationship between Q and . By measuring Q, we can find the power spectrum. How? Method 1: Ring down Method 2: Transfer function Method 3: Control loops (Future) Phase locked loop Amplitude locked loop
Reducing clamp loss Important to reduce clamp loss in order to measure true loss of silicon Si + R Steel where R = strain energy ratio = Esteel/(Esteel+ESi)
D E S I G N C R Y O S T A T
Results 241.5 Hz Mode: 296K, Q = 2784, Error = 6.2
Analysis Results indicate that clamp loss is still dominant To improve clamp, reduce strain energy lost in steel. We focused on clamp shapes and dimensions before Now we look into wafer design
Strain Energy Ratio Strain Energy Ratio Frequency (Hz) Frequency (Hz) 1) Reduce wafer thickness. 2) Decrease cantilever width 3) Simplify the geometry. Geometry might be why the 241.5 Hz mode had less loss than the 242 Hz mode. Use higher order modes too? Strain Energy Ratio 4) Study oscillation of the flaps rather than cantilevers Frequency (Hz)
Future Work Improve our current experimental design until we can measure a maximum Q 108 or better. Implement the control loops to continuously measure Q Understand changes in Q with temperature and frequency Then study the changes in Q of the silicon due to thin film deposition. Films will be for controlling reflectivity of masses. There could be deformations due to thin film deposition Additional sources of loss between How the curvature will affect laser reflectivity.
Acknowledgements Thanks to my mentor Nic Smith To Professor Rana Adhikari, Zach Korth, Professor Weinstein, NSF Everyone in the subbasement lab for being so helpful Fellow SURFs who made my summer so much fun!