Understanding Private Equity Fundamentals for Long-Term Value Creation
Private equity presents a compelling alternative to public equity, emphasizing active ownership and long-term value creation. This involves investing in non-traded equity stakes in private companies with the goal of enhancing performance and attaining profitability upon exit. Formal and informal private equity structures exist, with venture capital, growth equity, and buyout equity being common categories. Key players in private equity include General Partners (GPs) and Limited Partners (LPs), each with distinct roles in fund management and investment execution.

Download Presentation

Please find below an Image/Link to download the presentation.
The content on the website is provided AS IS for your information and personal use only. It may not be sold, licensed, or shared on other websites without obtaining consent from the author. Download presentation by click this link. If you encounter any issues during the download, it is possible that the publisher has removed the file from their server.
E N D
Presentation Transcript
CORPORATE FINANCE FOR LONG-TERM VALUE Chapter 10: Valuing private equity
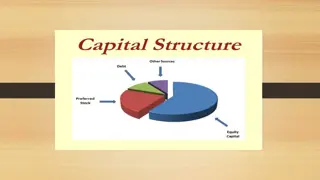
Part 3: Valuation of companies Chapter 10: Valuing private equity
The BIG Picture 3 Private equity is becoming a viable alternative to public equity Different dynamics Private equity is illiquid (no trading) But offers scope for involvement as active owner with company management And integration of S & E into company strategy Yet, private equity is behind on S & E integration and disclosure
Basics of private equity 4 Private equity (PE) funds invest in private companies By means of a non-traded equity stake for a multiyear period; With the aim to make a return by improving the investee companies performance; and Exiting them at a profit Formal private equity: a fund structure that raises capital from other investors Informal private equity: invest their own money (angels, families, etc.)
Formal types of private equity 5 Venture capital (Early stage) Three types of formal private equity: Venture capital: invests in early stage (startup) Growth equity (Growth stage) Private equity companies with a great but unproven idea Carry high risk and often negative cash flows Buyout equity (Mature) 2/3 of investments by VCs lose money, with high returns coming from a limited number of home runs Outstanding (in $ billions) Type of private equity Growth equity: assists company in achieving high growth 1,829 Venture capital Often with a minority stake, implying a lack of full control 988 Growth equity 2,994 Buyout equity Buyouts: takes a majority stake, funded with equity and 484 Other loans, to change the company s strategy and operations 6,295 Total private equity
Private equity fund structure 6 Private equity company General Partner (GP) Investment manager Responsible for managing the PE fund GP LPs Issues capital and makes investments Manages day-to- day business Deal sourcing, reporting, etc. Responsible for execution Fiduciary duty towards LPs Provide capital Not liable beyond contributed capital Have a 1-10% stake Investment Manager Executes daily operations (evaluating investments, reporting and auditing, advisory services) Advisory services GP interest Capital Limited Partners (LPs) Private equity fund Purely financial role, providing capital and paying fees Limited Partnership Agreement (LPA) Sets out the mandate of the fund May delegate management functions to the investment manager Investee company 3 Investee company 1 Investee company 2 Investee company n
Private equity J-curve 7 From the LPs perspective, the cash flows stream starts with cash outflows, and later on if successful cash inflows, resulting in a J-curve Problematic for institutional investors, since they need to commit to capital calls that are hard to estimate, resulting in potential liquidity problems PE fund J-curve of cash flows 60 Cash flows, $ millions 50 Capital calls (cash out) 40 30 20 Distribution (cash in) 10 0 1 2 3 4 5 6 7 8 9 10 -10 -20 Cumulative cash flow -30 Year -40
PE investment process 8 Pre-deal phase: lots of time and effort in finding Pre-deal funnel and selective prospective companies to invest in Filtering on several criteria (industry, business 1. Investment committee review model, technology, etc.) Investment made Preliminary and formal due diligence (DD) 2. Investment decision is made 3. Formal DD Preliminary DD Managing investments Pre-deal Deal Exit Deal sourcing
Leveraged buyouts (LBOs) 9 Leveraged buyouts (LBOs) use debt to take a majority stake in an investee company LBO PE portfolio companies are found to enhance innovation Kaplan and Str mberg (2009) distinguish three sources of value creation for LBOs: Financial engineering: debt-financing increases leverage and thereby disciplines managers Governance engineering: controlling the boards of their investee companies; management gets a larger stake to align their interests with the company Operational engineering: the ratio of operating income to sales increases, but the ratio of capital expenditures to sales declines at LBOs
Exits 10 There are several exit routes in PE LBOs: Percentage Type of exit (1970-2007 period) Most common exit is sale to a strategic Sold to strategic buyer (nonfinancial) buyer, typically another company 38% A trade to another PE fund is a secondary 24% Secondary buyout leveraged buyout (SLB) 14% IPO Initial public offerings (IPOs) occur when the 24% Other company is listed on the stock market and goes public 100% Total exits
Valuation of PE 11 Similar to public equity, the discounted cash flow (DCF) model is best for PE valuation Valuing PE is harder for two reasons: Concerns small, not (yet) profitable companies, making normalised projections difficult No market price or beta, and often lacking for comparable companies as well Example: cultured meat producer Perspective in year 1 Year 1 2 3 4 5 6 7 8 9 10 TV Initial focus on optimising the process: 0 2 50 200 400 520 624 749 824 890 890 Sales First few years with hardly any sales and -15 -28 -53 -183 -340 -432 -505 -607 -667 -738 -738 Costs -15 -26 -3 17 60 88 119 142 156 151 151 Cash flow significant costs, hence negative cash flows -6% 9% 15% 17% 19% 19% 19% 17% 17% CF margin -1300% From year 4 onwards: positive but uncertain TV 658 WACC 25% Discount factor PV of cash flow cash flows, hence high WACC (25%) 0.80 0.64 0.51 0.41 0.33 0.26 0.21 0.17 0.13 0.11 0.11 -12 -17 -2 7 20 23 25 24 21 16 71 NPV 176
Valuation of PE 12 After initial valuation, numbers are updated as milestones are met (or not) and expectations change, milestones may include: Reaching product cost levels Obtaining regulatory approval Launching a production line at scale Perspective in year 3 1 2 3 4 5 6 7 8 9 10 TV Year The expectations for the cultured meat 0 2 50 200 400 520 624 749 824 890 890 Sales -15 -28 -53 -183 -340 -432 -505 -607 -667 -738 -738 Costs producer have been met exactly, so: -15 -26 -3 17 60 88 119 142 156 151 151 Cash flow -1300% -6% 9% 15% 17% 19% 19% 19% 17% 17% CF margin Lower WACC (20%) 20% TV 840 WACC Discount factor PV of cash flow Result: NPV has tripled in year 3 0.83 0.69 0.58 0.48 0.40 0.33 0.28 0.23 0.23 -3 12 35 43 48 48 44 35 195 NPV 456
Valuation using multiples 13 Multiples valuation uses a multiple of a 2023 2028E Change 730 380 -350 Net debt financial statement metric such as profitability 600 1,600 1,000 Equity or book value to determine company value 1,330 1,980 650 Enterprise Value (EPV) 160 210 50 EBITDA Example: PE buys a company in 2023 8.3 9.4 1.1 EPV/EBITDA multiple (600 equity and 730 debt) 4.6 1.8 -2.8 Net debt/EBITDA Expects a rise in EPV from 1330 to 1980 Value drivers Change Calculation Explanation Improved profitability (EBITDA from 160 to 210) 350 net debt reduction Net debt impact change in EBITDA * original multiple multiple expansion * new EBITDA Improved multiple (EPV/EBITDA from 8.3 to 9.4) 416 50 * 8.3 EBITDA impact Paying back 350 in debt leaves 380 in 2028, 234 1.1 * 210 Multiple impact which means equity rises from 600 to 1600 Value creation 1,000 Check: rise in equity 1,000
Football field graph of valuation methods 14 PE companies also use other multiples: Revenue multiples: EPV / Revenue Earnings multiples: price-earnings (P/E) ratio PE companies employ several valuation methods, visualing the outcome using football field graphs $57.0 Public Comparables: 2023 P/E 2022 P/E 2023 EV/EBITDA 2022 EV/EBITDA Discounted Cash Flow: 9% Discount Rate, 8-12x Terminal Multiple 10% Discount Rate, 8-12x Terminal Multiple $40 $50 $60 $70 $80 $90
Cost of capital 15 Since non-listed companies do not have past stock returns and no observable beta, the betas of comparable companies or industry betas can be used However, such betas don t reflect the extra risk of early-stage companies Different approach: take high default cost of capital of 20% to 60% Phalippou (2020) found that PE has not been as financially successful as often claimed: PE funds have generated returns (after fees for PE managers) that are similar to public equity indexes since at least 2006, although with higher risk Conclusion: PE is particularly financially attractive for the PE managers
ESG integration in PE 16 The practice of ESG integration in PE seems to be lagging compared to ESG integration in public equity investing Mostly driven by the desire to comply with regulations and standards ESG due diligence is typically performed by external advisors Most PE companies do not have standardised ESG procedures PE companies should integrate the analysis of S and E during due diligence: Financials Management Business model Impact Competitive position Operations historical financials forecast / management projections risk-return assessment future financing rounds responsible exit scenarios organisation chart management team CVs & track record company culture customer value proposition profit model key resources & processes scalability SWOT analysis intellectual property markets client base (existing, pipeline, target, future opportunities), competition supply chain products / services historical impact value creation data theory of change
Valuation of S & E in PE 17 Early-stage PE tends to invest in newly emerging companies on the bottom left of the x-curve of transition Impact PE explicitly aims to create value for society For impact investments, financial returns are not the main objective, but just one of the objectives Impact PE companies can develop their own frameworks to deal with limited data availability For example, BlueOrchard developed an impact framework based on the principles of intentionality, contribution, measurement and governance Venture philanthropy is in between impact PE and charity: Unlike charity, it wants to maintain capital for future investments; Unlike impact PE it does not require a significantly positive financial return
Conclusions 18 Private equity funds are set up to invest in private companies for a predefined multiyear period, aiming to make a return by improving their investee companies performance and exiting them at a profit Despite being well suited for sustainable investing, private equity lags the public equity space in the application of sustainability considerations Given the active ownership role that private equity takes, value creation on E and S is potentially greater in private equity than in public equity Value creation on E and S is more likely if private equity fund actually steers on impact


")