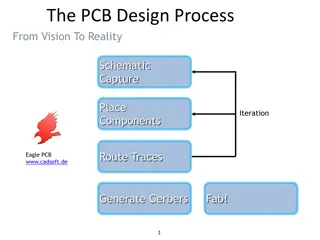
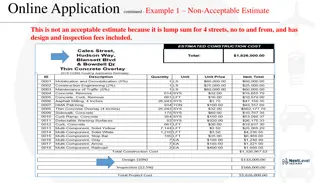
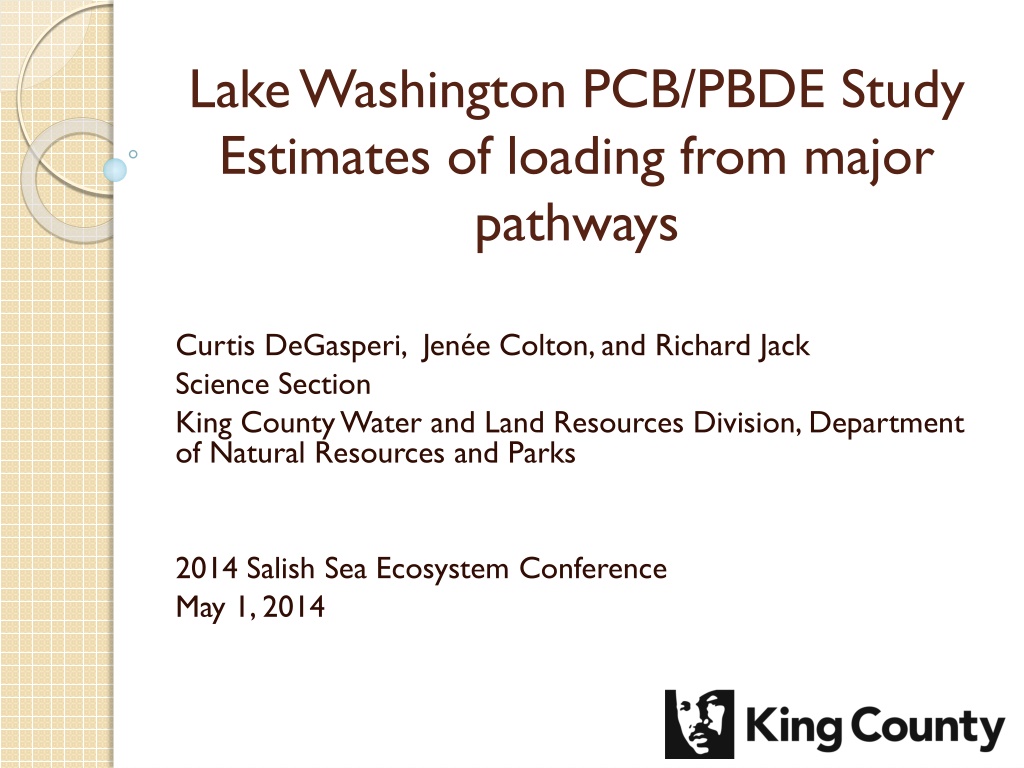
Lake Washington PCB/PBDE Study Estimates and Loading Pathways
This study presents estimates of loading of PCB/PBDE pollutants in Lake Washington from major pathways, including rivers, local drainages, and monitored tributaries. The data shows current PCB loading estimates to Lake Washington and its exits to Puget Sound, providing insights into sources and concentrations of these harmful substances in the ecosystem.

Download Presentation

Please find below an Image/Link to download the presentation.
The content on the website is provided AS IS for your information and personal use only. It may not be sold, licensed, or shared on other websites without obtaining consent from the author. Download presentation by click this link. If you encounter any issues during the download, it is possible that the publisher has removed the file from their server.
E N D
Presentation Transcript
Lake Washington PCB/PBDE Study Estimates of loading from major pathways Curtis DeGasperi, Jen e Colton, and Richard Jack Science Section King County Water and Land Resources Division, Department of Natural Resources and Parks 2014 Salish Sea Ecosystem Conference May 1, 2014
Major Pathways Rivers (Cedar and Sammamish) Local Drainages Monitored tributaries Thornton Creek Juanita Creek May Creek Remaining unmonitored lake drainage CSOs Floating bridges (stormwater runoff) Direct atmospheric deposition
Loadings Estimates Concentration X Flow = Loading Field study mean concentration used, except Extrapolation approach for unmonitored tributaries Enhanced CSO data with historical data Flow Gauged flow data OR Estimated
Correlations with Land Use/Population 2.5 2.5 tPCB (g/m2-yr) tPCB (g/m2-yr) Mean tPCB (g/km2-yr) Mean tPCB (g/km2-yr) 2.0 2.0 1.5 1.5 1.0 1.0 0.5 0.5 0.0 0.0 0 10 20 30 40 50 0 10 20 30 40 50 60 70 %Total Impervious Cover %Developed pre-1979 %Total Impervious Cover %Developed Pre-1979 2.5 2.5 tPCB (g/m2-yr) tPCB (g/m2-yr) Mean tPCB (g/km2-yr) Mean tPCB (g/km2-yr) 2.0 2.0 1.5 1.5 1.0 1.0 0.5 0.5 0.0 0.0 0 2 4 6 8 10 12 0 2 4 6 8 10 12 Population Density (#/acre) %Comm/Ind Developed Pre-1979 %Commercial/Industrial Dev pre-1979 Population Density (#/ac)
Relationship with Historical LandUse? %Commercial/Industrial Development PCB Yield 3.0 12 %Commercial/Inustrial Development 2.5 10 PCB yield (g km-2 yr-1) 2.0 8 1.5 6 1.0 4 0.5 2 0.0 0 Thornton Juanita May PCB yield %Commercial/Industrial Development PCB yield: 10.1258 PCB yield: 5.8440 PCB yield: 1.3166
Current PCB Loading Estimates 672 g yr-1 to Lake Washington 140 g yr-1 exits Lake Washington 360 g yr-1 to Puget Sound
PCB Loading Summary Bridges 3 g CSOs Rivers Local Dr. 450 g 110 g 4.8 g 12 g 97 g 140 g 360 g Puget Sound ? 672 g Bridges CSOs Local Dr. 1 g 58 g 40 g Lake Union/Ship Canal Lake Washington
Current PBDE Loading Estimates 2,023 g yr-1 to Lake Washington 968 g yr-1 exits Lake Washington 990 g yr-1 to Puget Sound Percent of Total Load 0 20 40 60 80 100 590 (29.2 %) Atmospheric Deposition 19 (0.9 %) Highway Bridges CSOs 14 (0.7%) 820 (40.5%) Local Drainage 580 (28.7 %) Rivers 0 500 1000 1500 2000 tPBDE load (g yr-1)
Load from Local Drainage Driven by Stormwater Stormwater is <30% of annual flow in streams BUT Accounts for 80-90% of annual PCB load from local drainage
Loadings Conclusions Appears to be relationship between local tributary PCB areal loading and age and/or type of development As much as 70% of lake PCB load comes from local tributaries As much as 80% of local tributary PCB load delivered in stormwater Lake Washington is a sink for PCB and PBDE
QUESTIONS? Search: lake washington pcb study http://www.kingcounty.gov/environment/watersheds/cedar-river-lake-wa/pcb-pbde-loadings.aspx