Analysis of Consumer and User Satisfaction Surveys in Indonesia
This report analyzes consumer and user satisfaction surveys conducted by BPS-Statistics Indonesia, focusing on data segmentation, satisfaction levels, and recommendations for data and services improvement. The surveys cover a wide range of institutions and provide valuable insights into the changing trends in consumer and user satisfaction over the years.

Download Presentation

Please find below an Image/Link to download the presentation.
The content on the website is provided AS IS for your information and personal use only. It may not be sold, licensed, or shared on other websites without obtaining consent from the author. Download presentation by click this link. If you encounter any issues during the download, it is possible that the publisher has removed the file from their server.
E N D
Presentation Transcript
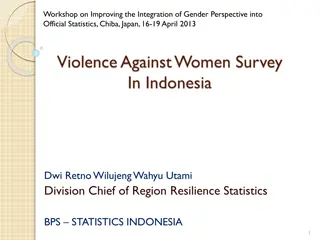
Consumer Consumer Satisfaction Satisfaction Survey Survey M. Ari Nugraha Directorate Dissemination of Statistics BPS-Statistics Indonesia Bogor, 17 June 2014
Data Sources Consumer Satisfaction Survey Conducted by third party Data Needs Survey Conducted by BPS (Internal)
Comparison (1) Consumer Satisfaction Consumer Satisfaction Survey Survey Data Needs Survey Data Needs Survey 2005 (HQ only) 2008 (HQ and Pilot in 5 BPS province) 2009 (HQ and 11 BPS Provinces) 2010 (HQ and 11 BPS Provinces, which different provinces with 2009) 2011-2013 (HQ and 33 BPS Provinces) 2014 (HQ, All BPS Provinces, and BPS Reg/Municipalities) 2010 (conducted by EY) 2012 (BPS) 2013 (MIM Consultant)
Comparison (2) Consumer Satisfaction Consumer Satisfaction Survey Survey Data Needs Survey Data Needs Survey 2005 (429 samples) 2008 (1.579 samples) 2009 (1.324 samples) 2010 (1.427 samples) 2011 (6.066 samples) 2012 (5.896 samples) 2013 (6.071 samples) 2014 (16.180 samples) 2010 (40 samples) 2012 (108 samples) 2013 (169 samples)
Comparison (2) Consumer Satisfaction Consumer Satisfaction Survey Survey Satisfaction index Data Needs Survey Data Needs Survey Satisfaction index Identify data needs Jabodetabek BPS BPS Province
User Satisfaction Survey User Satisfaction Survey - - 2013 2013 Conducted by Third Party
Objectives provides an overview and analysis of the data users segmentation and their level of satisfaction as well as recommendations on: Types of data and services required; The quality of data and services; Recommended follow-up actions to the survey results.
Respondent Coverage Unit Sample in this survey is the institution which ever used the BPS data. The number of institutions that are expected from the implementation of this survey that represents or includes: Ministry / Agency The local government International Institute Mass media Company / Business Banks / Financial Institutions Academy and Research Institute
Areas Coverage DKI Jakarta West Java Province Bekasi (Regency/ Municipality ) Bogor (Regency/ Municipality) Depok (Municipality ) Banten Province Tangerang (Regency/ Municipality ) South Tangerang (Regency ).
Content (1) Respondent s Identities Services satisfaction Data Satisfaction : GDP Export-Import Industry Agricutural Price Household Expenditure and others social statistics Labor etc
Content(2) Satisfaction for Data quality, likely: Accuracy Timelines Relevance Accessibility Comparability Coherence
RESULT Satisfaction Index 82.1% Satisfy/ the above Standard Level of Satisfaction 75.1% Gap 17.9% Satisfy/ the above Standard Level of Importance 91.6% Very High / Most expected Gap 24.9% Possible to improve 8.4%


")
")
")


")
")