Perception of Prosopis Impact on Livelihood Diversification Among Pastoralists
Study conducted in the Afar region of Ethiopia explores pastoralists' perceptions of Prosopis juliflora and its impact on livelihood diversification strategies. The invasive species poses challenges to native trees and grazing lands, but also offers opportunities for alternative income sources. The research aims to assess factors influencing community perception of Prosopis and pastoral livelihood diversification strategies.
- Livelihood diversification
- Pastoralists
- Prosopis juliflora
- Community perception
- Livestock production

Uploaded on Oct 09, 2024 | 0 Views
Download Presentation

Please find below an Image/Link to download the presentation.
The content on the website is provided AS IS for your information and personal use only. It may not be sold, licensed, or shared on other websites without obtaining consent from the author. Download presentation by click this link. If you encounter any issues during the download, it is possible that the publisher has removed the file from their server.
E N D
Presentation Transcript
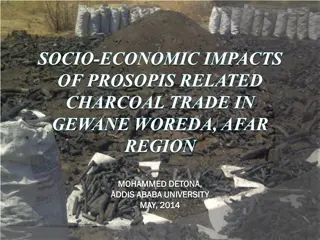
HOUSEHOLD PERCEPTION ABOUT PROSOPIS AND ITS EFFECT ON PASTORAL LIVELIHOOD DIVERSIFICATION STRATEGY MOHAMMED JEMANEH SEID (mame.seid3@gmail.com) Afar Pastoral and Agro-Pastoral Research Institute (APARI) Socio-Economic Research Department May, 2014
Outline of the Presentation Introduction Methodology Results and discussion Summary, Conclusion and Recommendations 2
1.1 Background of the Study In Ethiopia, Pastoralists constitute 11 percent of the total population. Pastoralists raise 50-70 % of their livelihood from livestock. However, 1.5 million (27 %) earn good revenue from livestock (CSA, 2007). Pastoralists are exposed to climate changes including drought and dwindling pasture land by invasive alien species (IAS). The aggressive invasion of Prosopis juliflora in pastoral areas is displacing native trees, and reducing grazing potential (Pasiecznik et. al., 2001).
1.2 Statement of the Problem Afar Region is one of food insecure regions. The area is pastoral region with 90% people depending on subsistence livestock production (CSA, 2007). Over 700,000 hec. of land is either invaded or at risk of invasion in the Afar Region, (US FS, 2006). Eradication of the weed has been one of the means of controlling the devastating effects of the weed. But for how long?? The Afar community realize that productive utilization of Prosopis has a dual purpose According to a survey conducted in Gewane and Amibara districts; 87 % of the interviewed agro-pastoralists were engaged in other activities such as selling labor, charcoal prod n and trade (US FS, 2006).
Statement of the Problem (contd) A DFID project (R7295) recommend eradication was not only impossible but also unnecessary if the knowledge contained therein was applied effectively, while also effectively controlling further spread (Pasiecznik et al., 2001). On the other hand, Barrett et al. (2001) suggest that reasons can be classified as push and pull factors where Diver/n by poor HH in developing countries is usually a response to push factors. However, the studies carried out in the area either rarely consider the likely effect of the invasive weed on pastoral livelihood and perception related issues or sufficient information is not available concerning prosopis. Therefore, this study was designed to highlight the facts underlying pastoralist s perception about prosopis and pastoral livelihood diversification strategies in Gewane district of Afar regional state.
1.3 Objectives of the study Objectives : To assess the determinants of livelihood diversification strategies of pastoralists To identify factors affecting community perception concerning Prosopis juliflora. To assess the effect of pastoralists perception regarding Prosopis on their livelihood diversification strategies.
2.1 The study area Gewane Location: South Afar Area: 86,796 square kilometers Population: 25331/31,313 =81%, rural Livelihood: Pastoral in 2 kebeles Agro-pastoral in 8 kebeles
2.2 Sampling, and Data Collection A three-stage sampling procedure was followed. First, Gewane was selected purposively. Second, 5 kebeles (Gebeyaborra, Amassabure, Urrafita, Gelilladora and Bereiforra) were selected randomly. Finally, a total of 150 respondents were randomly selected based on proportion to size Primary data was collected through pre-tested structured questionnaire and Informal interview. Secondary data was collected from written documents and recent research works.
2.4 Data Analysis 1 Tabular analysis using means, SD, percentages, SDI, X2 and t-test 2 Multinomial logit model and two-step instrumental variable Tobit (ivtobit) model were used To identify the perception of the farmers a likert scale items, which had a different grade used to calculate perception index, then the result was classified into bad/disfavor, neutral, and good/favor category.
2.4.1 Multinomial logit model construction According to McFadden (1973), the multinomial logit model is derived from random utility function. Supposing that for the ith individual that is faced with j alternatives (the perception categories) indexed as j = 1, 2, , n, then the individual s utility (Uij) from the choice alternatives as Where Xij is a vector of factors that explain the decision made (in this case, the perception categories) by individual respondents, ij is a set of parameters that reflect the impact of changes in Xijon Uij, and ijis an unobservable error term. If Yi is a random variable that indicates the choice made, then the probability that alternative j is chosen is given by
Continued The equation can be normalized by assuming ij = 0, in which case the probabilities can be estimated as: prob This observation is the usual basis for Hausnan s specification test. The statistic is The marginal effect on the probability that Pr(y=1) implied by the marginal increase in a given explanatory variable is computed by: The Hausman test of (IIA) was also employed to check whether independence of irrelevant alternatives assumption is violated.
2.4.2 ivtobit model To assess the factors influencing pastoral livelihood diversification, two step instrumental variable tobit regression model was employed on the different means of livelihood defined by Simpson s diversification index (Patil and Taillie, 1982) as dependent variables. Two-step Tobit model (ivtobit) The Tobit model involving endogenous regressor, can be explained + + Y2= +
Continued For joint normal errors = v+ , where is an independent normal error, so + Whereas, a two-step estimation procedure calculates predicted residuals from OLS regression of on Xand then obtains Tobit estimates from the model as follows: Where, the error is normally distributed. To test whether the applied ivtobit estimator, is consistent and more efficient than an alternative Tobit estimator, Hausman s model specification test and Wald test on exogeneity were also employed.
3.1 Household and Economic Characteristics Household Perception Categorical variables Disfavor Fre. 19 Neutral Fre. 17 Favor Fre. 21 Total % % % Fre. 57 % 38.0 Sex Female 25.0 47.2 55.3 11.69*** Male Illiterate 57 66 75.0 86.8 19 31 52.8 86.1 17 35 44.7 92.1 93 132 88.0 62.0 Education level 0.82 Literate Single Married Divorced Widowed No Yes No Yes 10 12 62 1 1 6 70 53 23 76 13.2 15.8 81.6 1.3 1.3 7.9 92.1 69.7 30.3 50.2 5 6 26 2 2 6 30 21 15 36 13.9 16.7 72.2 5.6 5.6 16.7 83.3 58.3 41.7 24.5 3 7 23 3 5 10 28 22 16 38 7.9 18.4 60.5 7.9 13.2 26.3 73.7 57.9 42.1 25.5 1 25 111 6 8 22 128 85.3 96 54 150 12.0 16.7 74.0 4.0 5.3 14.7 Marital status 11.33** Ext. service 7.02** 64.0 36.0 100 Technology Total 2.202
Household Characteristics (continued) Household Perception Neutral Continuous variables Favor Disfavor t-test mean SD mean SD mean SD SDI Age Year lived Adult equivalence Market distance TLU per adult Ha of land cul. Total land own Exp. Livestock Exp. Farming Exp. Prosopis Exp. on irri. 0. 24 36.51 35.69 4.13 26.34 9.64 1.04 11.76 27.46 1.63 0.04 1.05 0.232 7.965 7.687 1.729 27.495 7.97 1.10 6.46 10.26 2.13 0.34 2.09 0.27 37.89 38.11 4.68 24.14 7.56 1.11 14.42 24.39 1.89 0.64 1.33 0.23 0.363 7.551 7.577 1.796 9.577 7.34 1.06 8.48 9.92 2.13 2.59 2.18 0.220 9.684 11.413 1.506 57.868 7.22 1.18 6.73 11.17 2.02 1.98 2.34 2.66*** -1.3 0.84 2.07** 0.08 -1.79* 2** 2.27* -0.69 0.286 5.6*** 1.4 38.71 35.74 3.89 28.50 7.27 .93 10.39 28.08 1.58 1.34 1.76
3.2 Determinants of HH perception..multinomial logit output Option Variables B Odd ratio Wald P value Age of household head 2.21 1.04** 0.529 -0.145 0.154 9.15 2.83 1.69 0.865 1.17 2.65 4.88 1.33 -2.09 1.29 0.118 0.039 0.314 0.172 0.326 sex education Not Good (Disfavor) Year adultequi tluperadequ 0.078** 1.08 4.30 0.050 Divern -3.09** 0.199 0.074 0.045 1.22 1.08 -6.12 0.45 0.23 0.026 0.695 0.838 Conflict Drought mktdistance 0.016* 1.02 3.02 0.094 exservice 0.774* 1.67* 0.036 -0.836 1.64 0.014 -0.001** 2.17 5.31 1.04 0.434 5.13 1.01 0.999 3.08 2.95 0.62 -2.61 2.71 0.43 -5.95 0.091 0.098 0.600 0.121 0.113 0.711 0.027 landccprad expecc expepp technology landowner totaly
Option Variables B Odd ratio Wald P value Age of household sex education Year 1.897* -0.733** -0.725 -0.114 -0.317 0.078*** 0.262 3.114*** 1.179 0.015 -0.661 -0.960 -0.219* 0.629* 1.092 -0.184** -6.05e-06* 126.48 0.000 0.384 -101.554 6.67 0.480 0.484 0.892 0.728 1.08 1.29 22.5 3.25 1.01 0.516 0.383 0.803 1.87 2.98 0.832 0.999 3.10 -4.37 -1.55 -1.80 -0.98 11.57 0.48 13.01 0.52 2.08 -1.01 -0.59 -3.23 3.43 1.39 -4.53 -3.64 No. observ/n 0.090 0.049 0.262 0.214 0.432 0.000 0.680 0.006 0.652 0.173 0.418 0.614 0.084 0.075 0.300 0.045 0.068 150 Good (Favor) adultequi tluperadequ Divern Conflict Drought mktdistance exservice landccprad expecc expepp technology landowner totaly LR chi2(34) Prob > chi2 Pseudo R2 Log pseudo likelihood
3.3 Marginal effects Estimation after mlogit model Dependent variable == Pastoralists Perception on prosopis Disfavor (0) Variables dy/dx SE ageHH .398*** .153 sex .312** .134 eduHH .172 .177 year -.027*** .011 adultequi .064 .055 tluperadu .013 .010 Divern -.622*** .124 Conflict -.126 .155 Drought -.050 .213 mktdst .003 .002 exservice .247* .136 landccpad .493 .325 expecc .027 .047 expepp -.259** .113 landowner .296* .175 total .019* .011 Favor (2) SE Neutral (1) SE .162 .130 .159 .011 .048 .010 .115 .148 .209 .003 .137 .275 .038 .076 .151 .009 X dy/dx -.463*** -.119 -.068 .030*** -.012 -.017* .403** -.143 -.055 -.004 -.067 -.235 .004 .110 -.295** .006 dy/dx .066 -.193* -.104 -.003 -.053 .004*** .220*** .269 .105 .001 -.180 -.259 -.031 .149*** -.001 -.025*** .072 .103 .076 .006 .037 .006 .085 .085 .101 .001 .125 .231 .038 .054 .100 .008 1.87 .62 .12 36.29 4.21 8.54 .67 .73 .92 26.36 .85 .26 1.68 .51 .36 12.05
3.4 Determinants of livelihood diversification (Two-step tobit with endogenous regressors) SDI= Dependent VariableWald chi2(10) == 135.48 Prob > chi2 == 0.0000 Instrumented: callperc Variables Coefficient SE age2 adultequi tluperadequ ltfarmy landccpradt technology training expli expecc callperc _cons Wald test of exogeneity: chi2(2) = 5.44 Hausman Specification Test H0: difference in coefficients not systematic Chi2(10) = 32.28 p-value = 0.0004 ivtobit superior to OLS and tobit -.001* .056*** .014*** .004 .302*** .110* -.011 .003 .0059 .202*** -.481** .001 .014 .003 .023 .100 .061 .064 .002 .014 .053 .210 Prob > chi2 = 0.0196
4.1 Summary Results of descriptive analysis showed that household perception about prosopis juliflora accounted 50.7% unlikely perceive, 24% neutral and 25.3% likely perceive. Results of multinomial logit on household perception about prosopis showed that sex (male-headship), TLU per adult equivalent, market distance, extension service, and hectare of land cultivated had a significant and positive influence on bad perception option. Results of instrumental variable tobit on SDI showed that age and training were negatively influence SDI. But positive and significant sign was observed for the determinants; adult equivalent, TLU per adult equivalent, access for technology, household perception, and Hectare of land cultivated. The latter factors increase the levels of household diversification. 4.1 Summary
4.2 Conclusion and Policy Recommendation 1. Although crop and livestock were currently the main income sources of households in the area, pastoralists are disadvantaged by provision of physical infrastructure, credit, and improved seed. Policy makers, therefore, must concentrate on measures to increase income from these activities. 2. The result shows that diversification strategy and household perception are largely determined by the same variables. By removing those barriers like the provision of training and education programs, households would improve their perception and be able to participate in diversification. Consequently, participation in different livelihood activities will have a likely effect on the income distribution and pastoralist livelihood improvement.
Conclusion and Policy Recommendation (continued) 3. Livelihood diversification, was crucially affected by household perception. Policies aimed at promoting farm-level productivity and self sufficiency need to emphasize this interdependency. 4. The fact that male-headed households had bad perception about prosopis and that were less likely to diversify using prosopis product confirms that they were neglected by other service providers. The concerned entities need to implement policies that farmer easily access training, market, and technologysupport. 5. Cultivated farm size was found to positive and significant coefficient. Thus, to increase gain and farm productivity, concerned governmental and non-governmental entities need to support pastoralists through fertilizer, improved seed, credit union (cooperatives) and target extension service.
Conclusion and Policy Recommendation (continued) 6. Productive utilization of prosopis, which was one of a decisive controlling mechanism for further invasion, might be associated with food security and animal nutrition since income had more favorable nutrition effects among pastoralists. It is important that promotion of such activity is incorporated into policy efforts aimed at reducing food insecurity and prosopis invasion. Therefore, policy designers need to focus on policies that can facilitate participation in such activity and enhance profitability of existing off-farm activities. 7. Finally, even though the survey findings show a positive association between the household perception and degree of livelihood diversification, and complementarities between farm and off-farm income in the study area, further empirical research addressing different scenarios of the pastoralists and rural residents elsewhere should be made before proposition of more widely applicable statements and policy recommendations.
For more information , you can download the file: http://www.tjprc.org/view_archives.php?year=2012_2... You can comment me by email address: mame.seid3@gmail.com


")


")


")
")